Fig. 1.
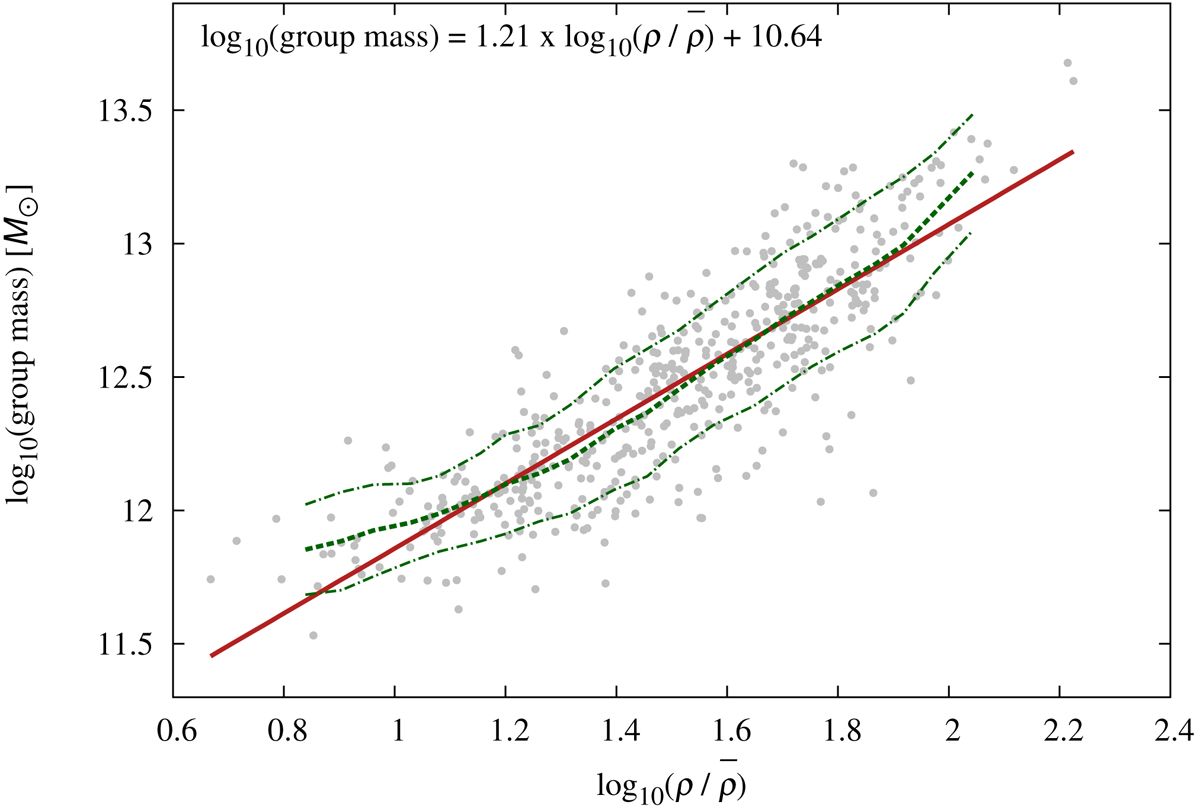
Group mass vs luminosity density of selected BGGs (grey points) in the EAGLE simulation. The thick green dashed line shows the median of a Gaussian fit to the group mass of the data points at different density values, while the thinner green dash-dotted lines show 1σ standard deviations from the median. The relation between the logarithms of group mass and luminosity densities shows a clear correlation that can be approximated by a linear fit, shown with the red line and the corresponding formula in the top of the figure.
Current usage metrics show cumulative count of Article Views (full-text article views including HTML views, PDF and ePub downloads, according to the available data) and Abstracts Views on Vision4Press platform.
Data correspond to usage on the plateform after 2015. The current usage metrics is available 48-96 hours after online publication and is updated daily on week days.
Initial download of the metrics may take a while.