Fig. 8.
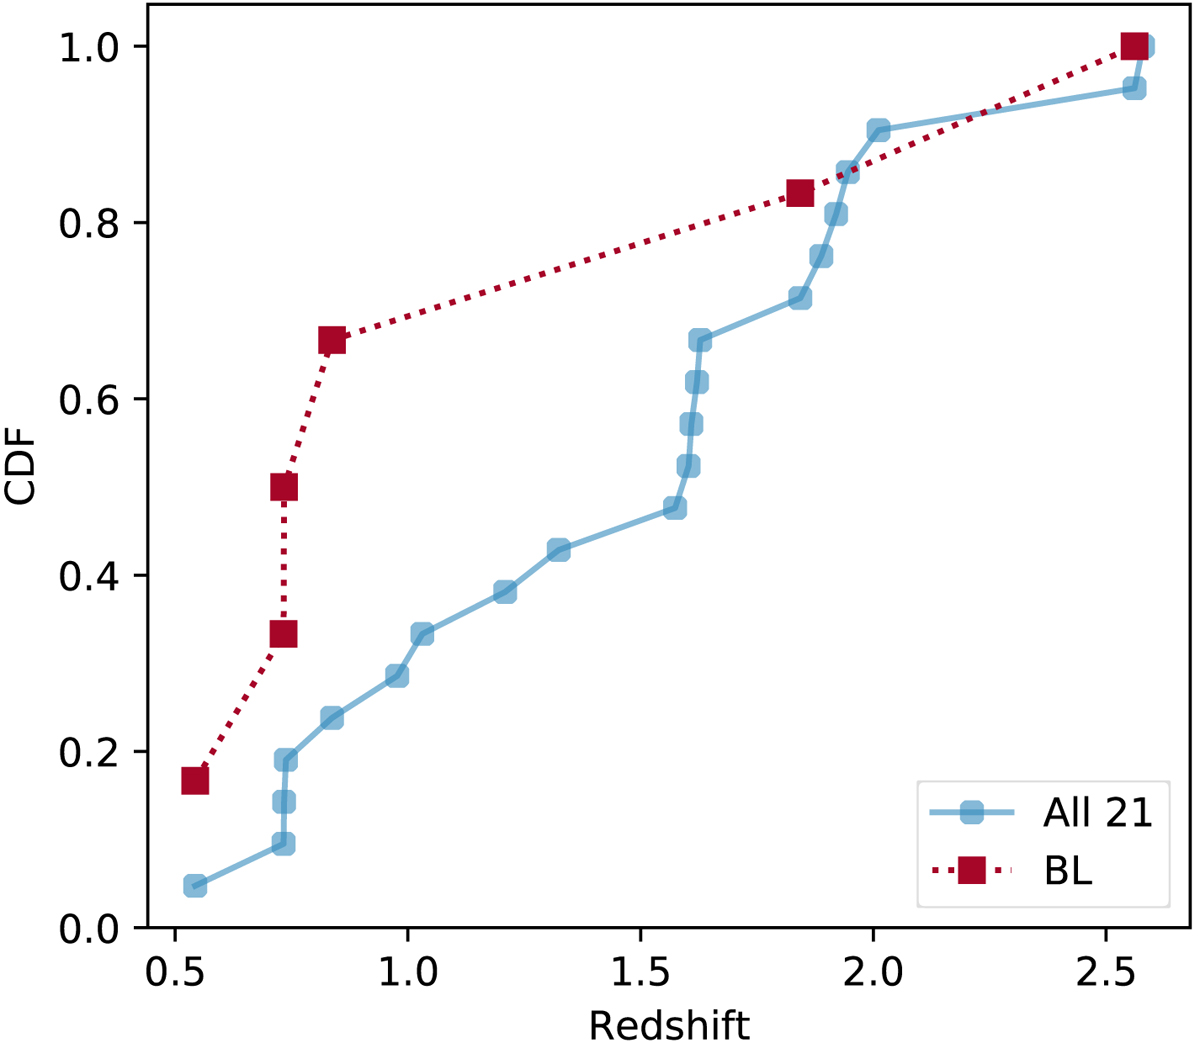
Cumulative distribution functions of the redshifts of the 21 unobscured AGN with good data quality (blue circles) and those of the six in which broad Fe lines are detected (red squares). The redshifts of the sample AGN are spread over the range of 0.5–2.6 with some clustering in the z = 1.6–2 range. In contrast, broad line detections may be frequent at low redshifts (z < 0.9).
Current usage metrics show cumulative count of Article Views (full-text article views including HTML views, PDF and ePub downloads, according to the available data) and Abstracts Views on Vision4Press platform.
Data correspond to usage on the plateform after 2015. The current usage metrics is available 48-96 hours after online publication and is updated daily on week days.
Initial download of the metrics may take a while.