Free Access
Fig. 4.
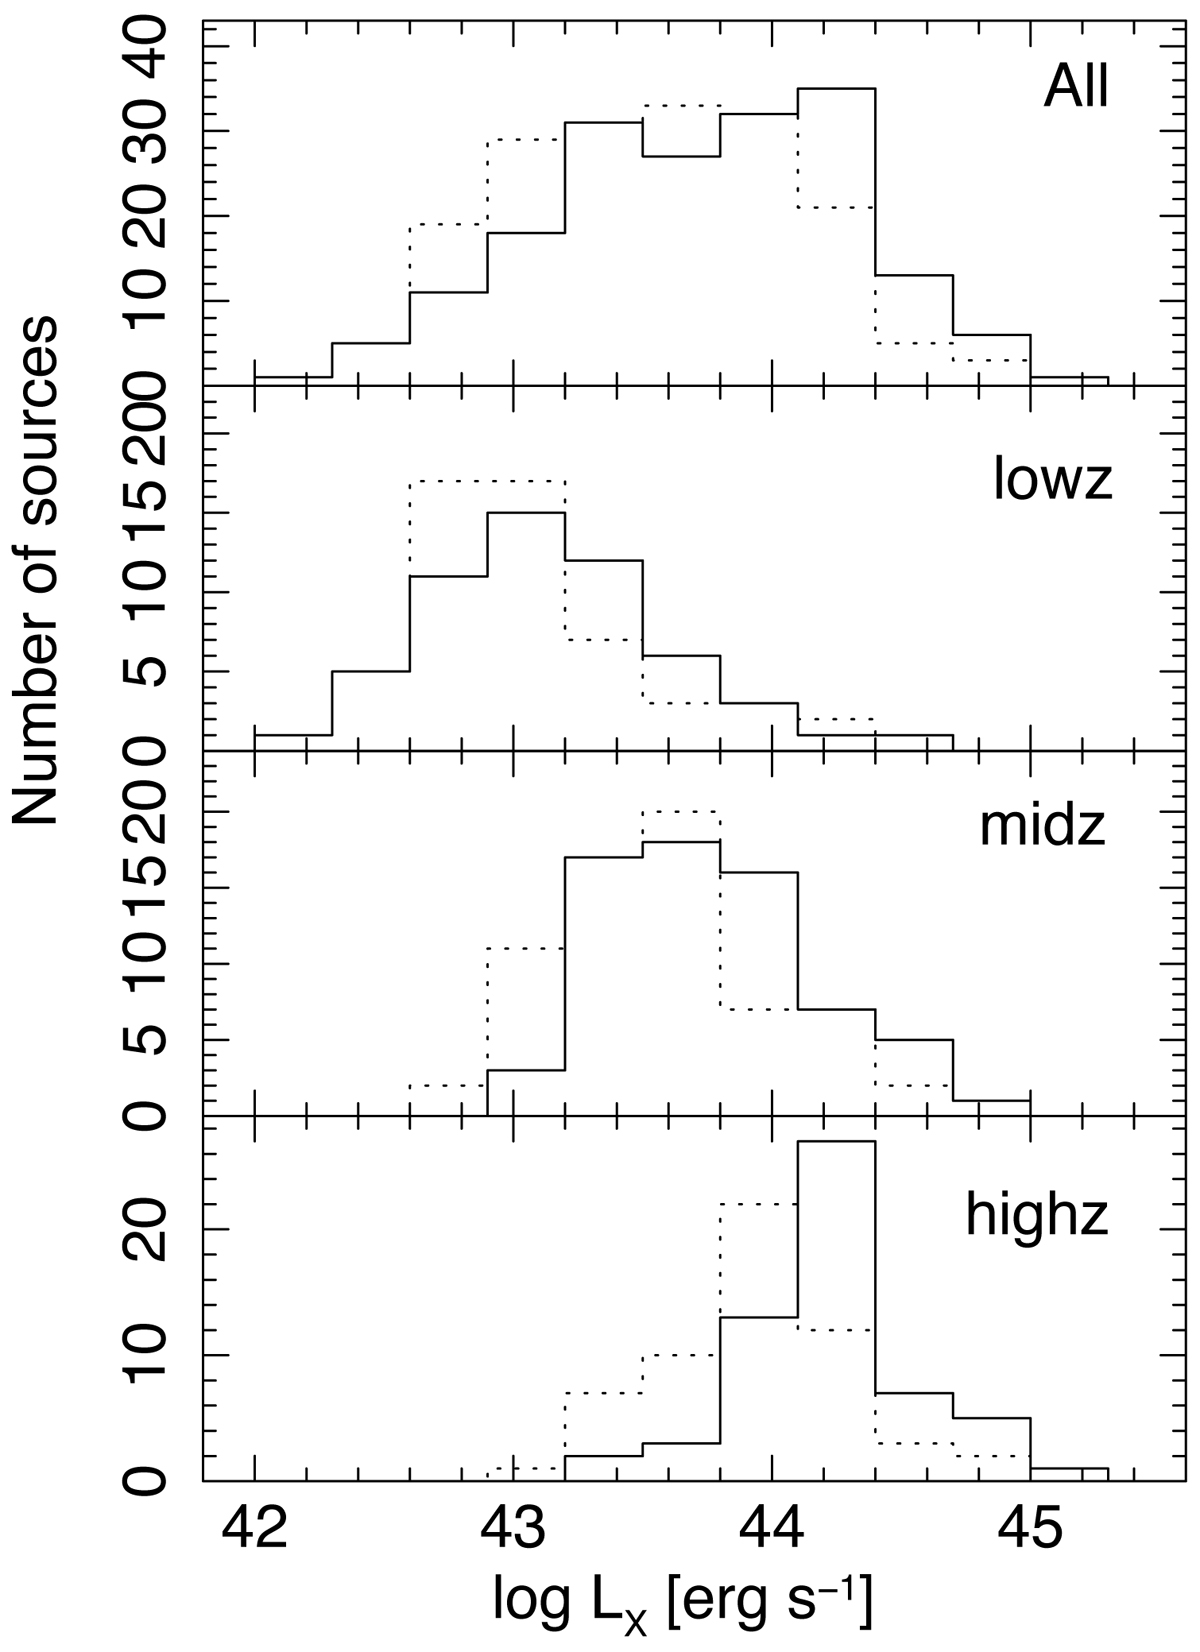
Rest-frame 2–10 keV luminosity distributions for all the 180 sources, the lowz, midz and highz sources. The solid line histograms denote the distribution of absorption-corrected luminosity, while the dotted lines are for luminosity as observed.
Current usage metrics show cumulative count of Article Views (full-text article views including HTML views, PDF and ePub downloads, according to the available data) and Abstracts Views on Vision4Press platform.
Data correspond to usage on the plateform after 2015. The current usage metrics is available 48-96 hours after online publication and is updated daily on week days.
Initial download of the metrics may take a while.