Fig. 3.
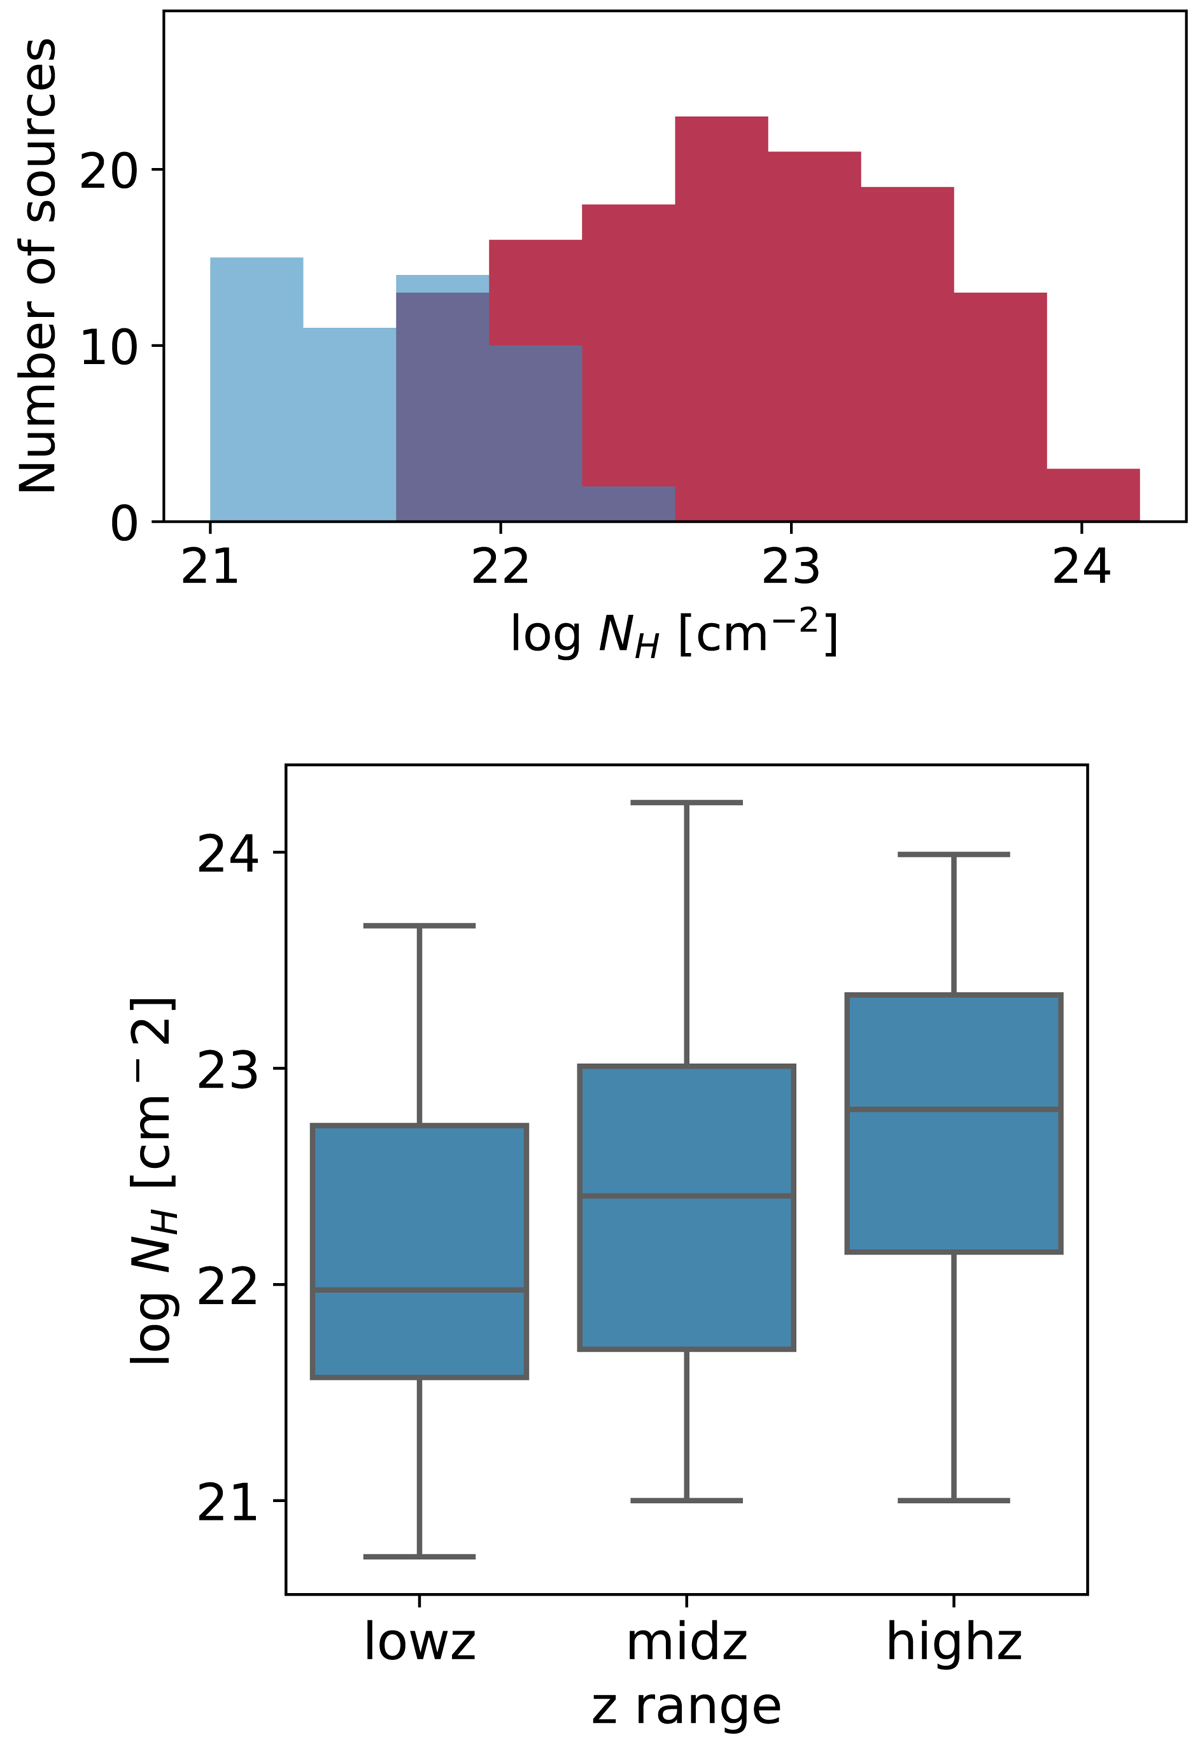
Upper panel: distribution of best-fit NH values obtained for all the 180 sources at z > 0.4. The histogram in red shows the NH distribution of absorption detected sources, while the blue histogram shows that of the upper limits. We note the limited but uniform sensitivity of our spectra to NH due to the rest-frame bandpass (see text). Lower panel: box-and-whisker plots of NH measurements for the lowz, midz and highz groups. Following the normal convention, the box represents the inter quatile range (the middle 50%), the bar in the middle represents the median value, and the whiskers show the range of the minimum and the maximum of the distribution.
Current usage metrics show cumulative count of Article Views (full-text article views including HTML views, PDF and ePub downloads, according to the available data) and Abstracts Views on Vision4Press platform.
Data correspond to usage on the plateform after 2015. The current usage metrics is available 48-96 hours after online publication and is updated daily on week days.
Initial download of the metrics may take a while.