Free Access
Fig. C.2.
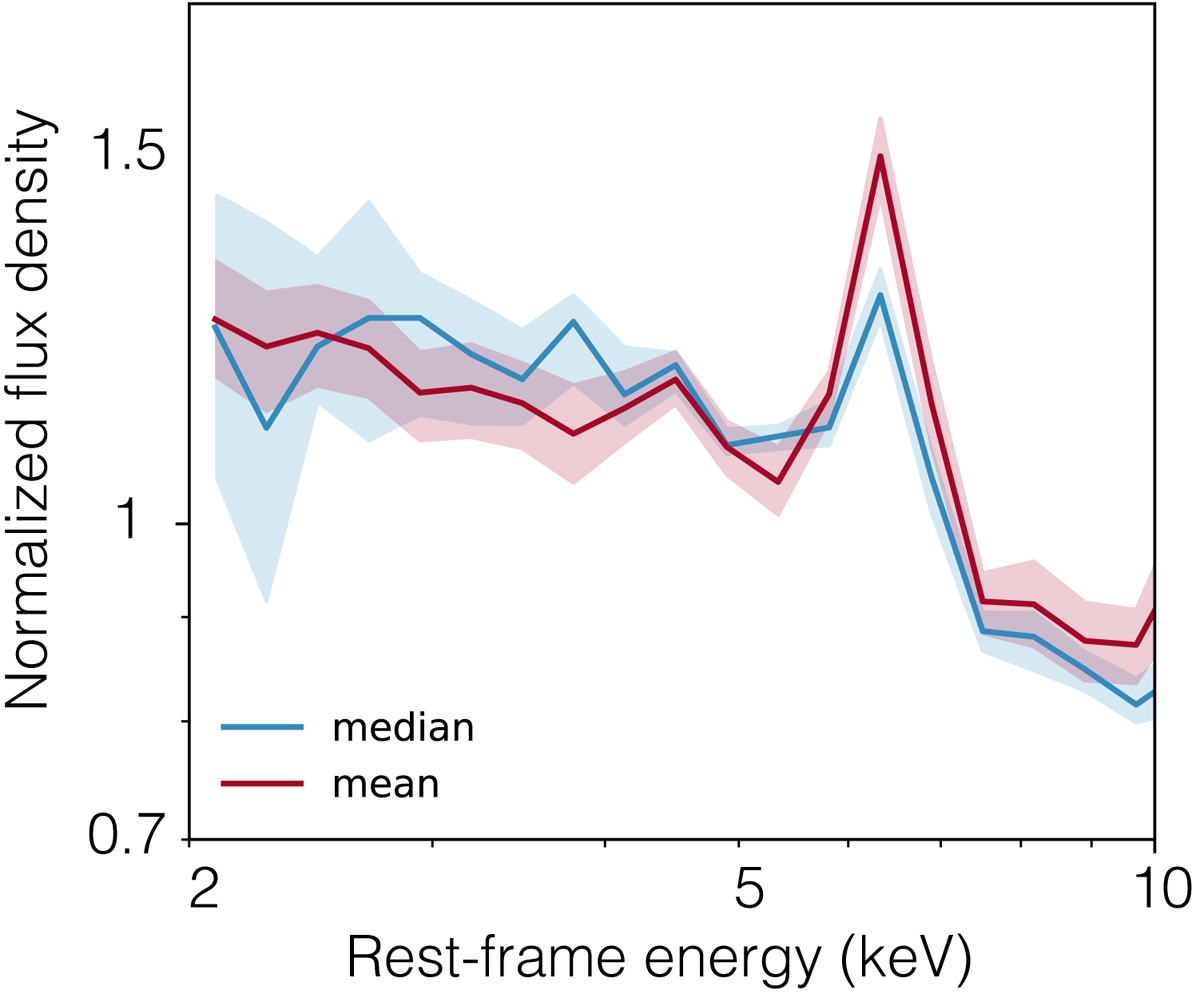
Composite spectra of all the 180 XMM-CDFS sources at z > 0.4, constructed by median (blue) and mean (red) stacking. The composite spectrum of Fig. 12 in the main text is identical to that of median stacking.
Current usage metrics show cumulative count of Article Views (full-text article views including HTML views, PDF and ePub downloads, according to the available data) and Abstracts Views on Vision4Press platform.
Data correspond to usage on the plateform after 2015. The current usage metrics is available 48-96 hours after online publication and is updated daily on week days.
Initial download of the metrics may take a while.