Fig. B.1.
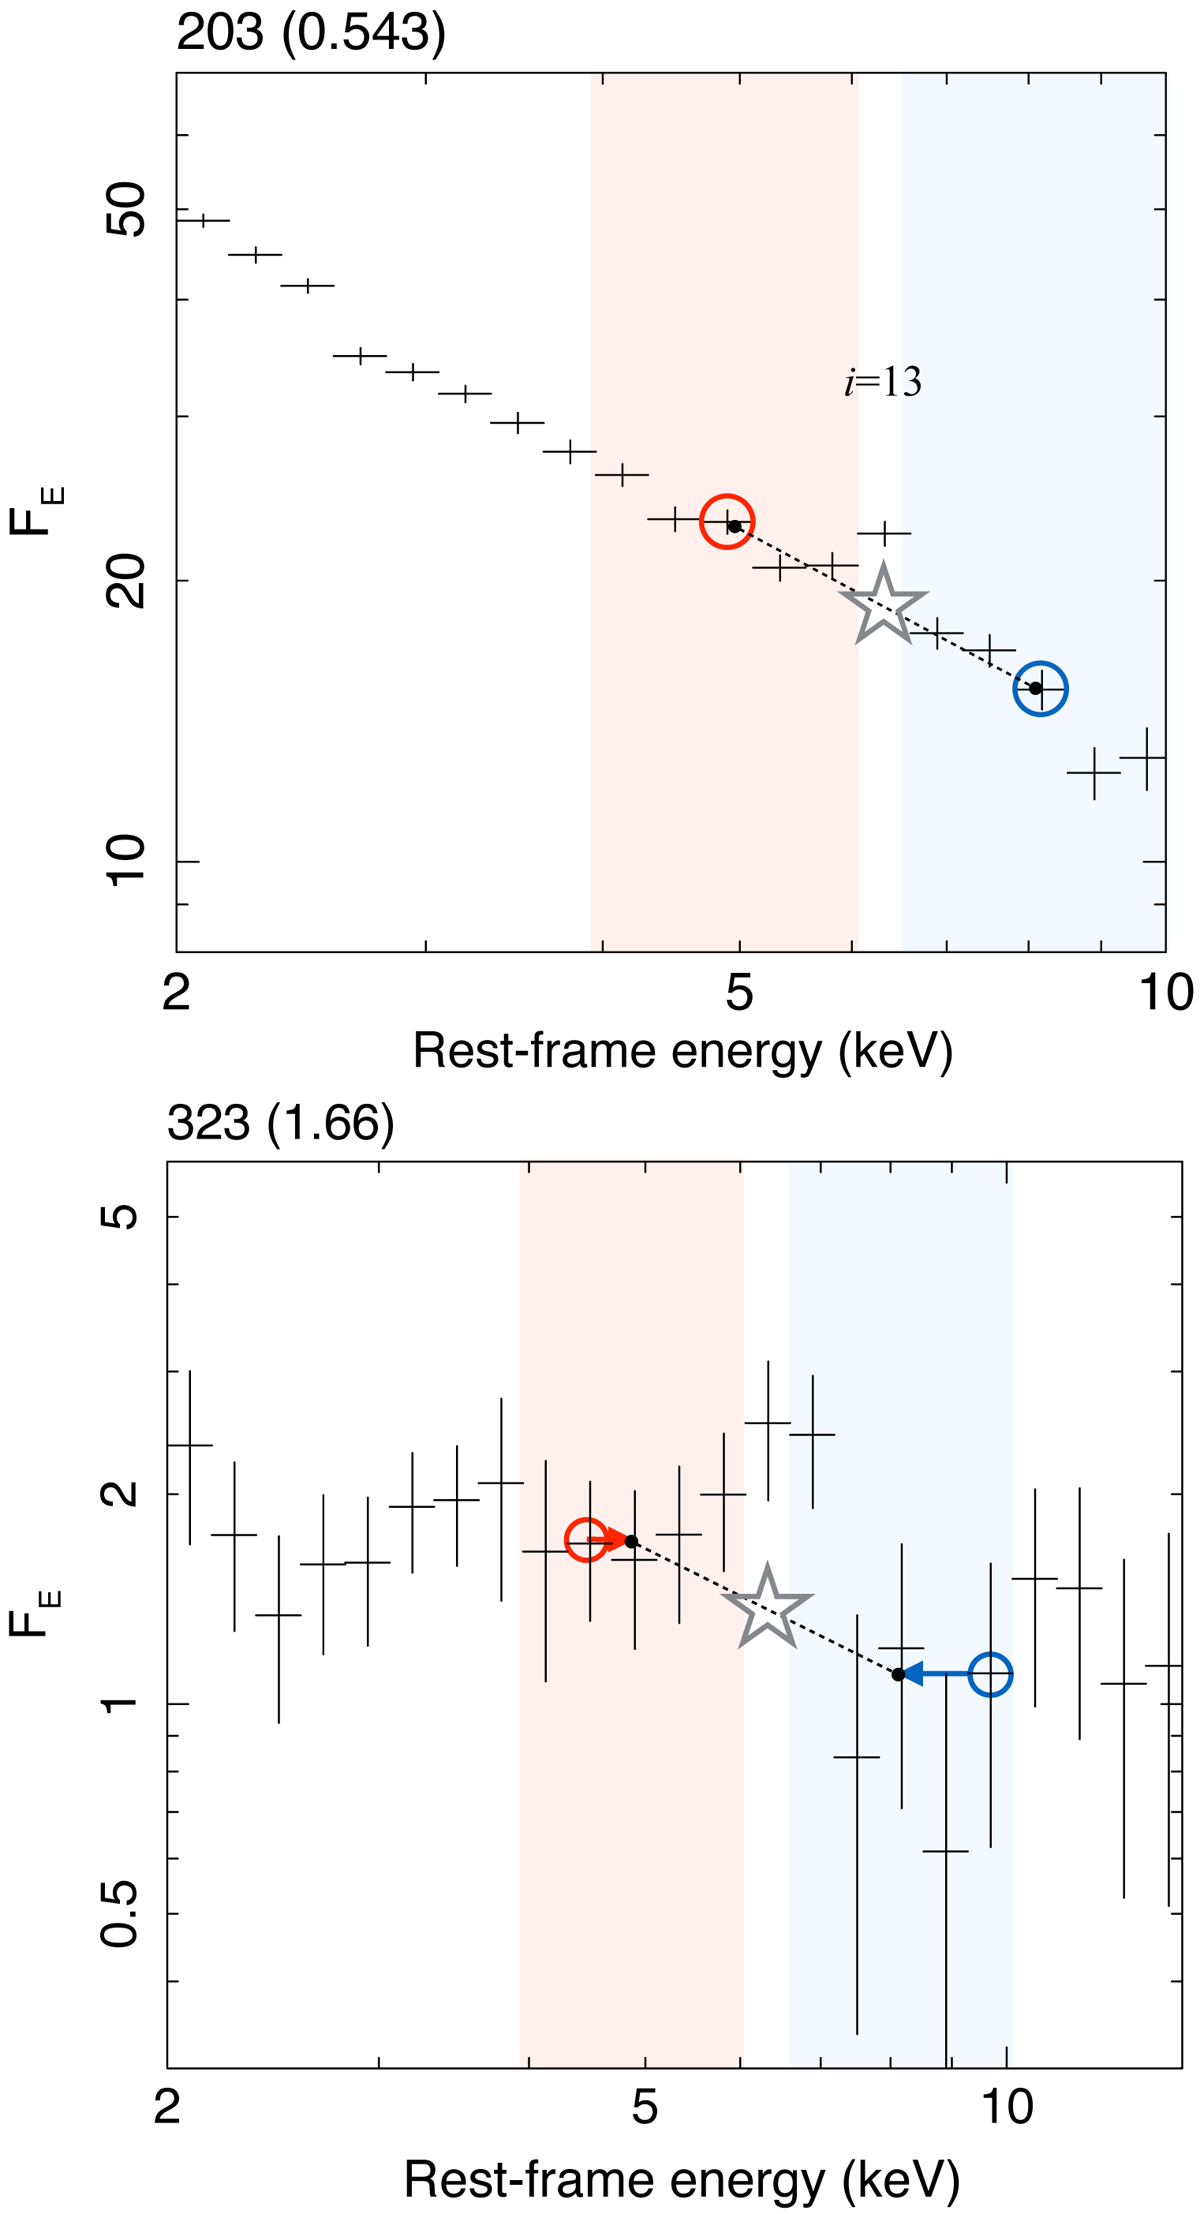
Examples of Fe K continuum estimates for PID 203 and PID 323. A value inside the parenthesis following the PID in each figure is adopted source redshift. The shaded areas indicate the lower and higher energy ranges encompassing the Fe K band. The open circles indicate where the median values are found in the respective energy ranges. The dotted line is an adopted continuum between the 4.9 keV (i = 10) and 8.2 keV (i = 16) with the estimated continuum level at i = 13 (open star).
Current usage metrics show cumulative count of Article Views (full-text article views including HTML views, PDF and ePub downloads, according to the available data) and Abstracts Views on Vision4Press platform.
Data correspond to usage on the plateform after 2015. The current usage metrics is available 48-96 hours after online publication and is updated daily on week days.
Initial download of the metrics may take a while.