Fig. 20.
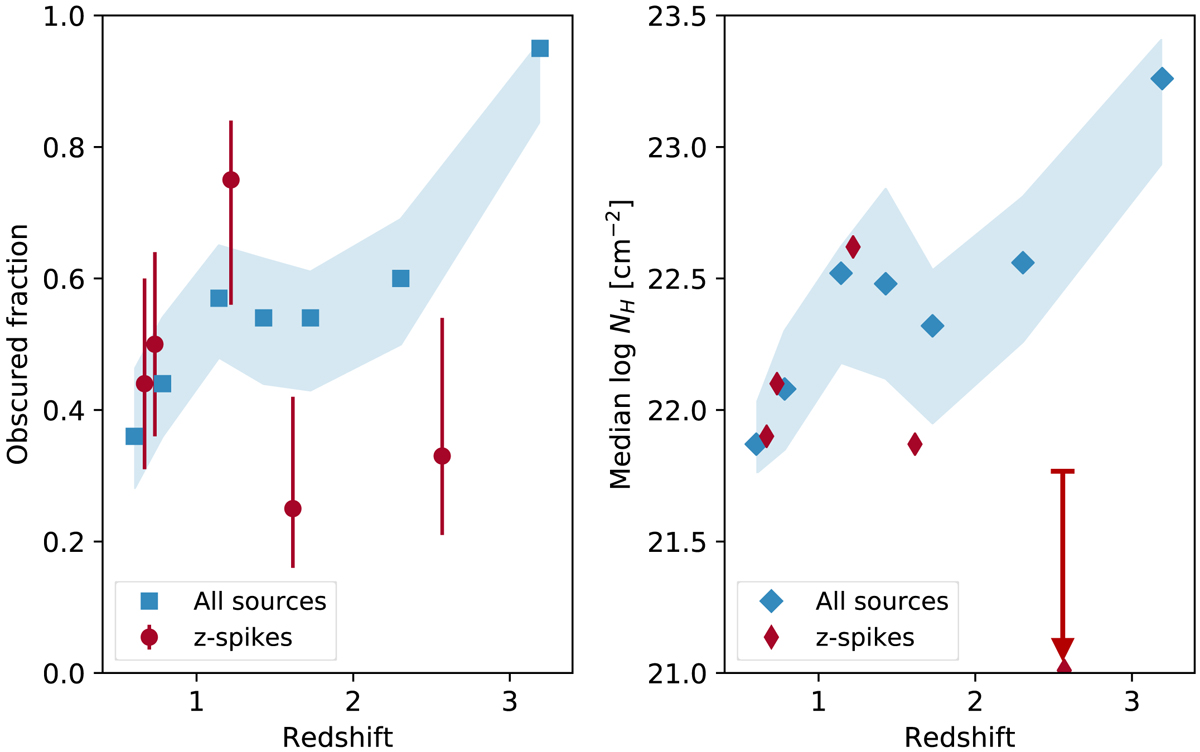
Left: proportion of obscured AGN as a function of redshift. The blue squares show data for seven redshift ranges: 0.4–0.7, 0.7–1, 1–1.3, 1.3–1.6, 1.6–2, 2–2.6, and 2.6–3.8 in z. The 68% credible interval is indicated by the shaded area. The red filled circles are data for sources in the five redshift spikes. Right: median absorbing column density for the whole sample as a function of redshift. The shaded area indicates the 68% bootstrap error interval. The red symbols show the values for the five redshift spikes.
Current usage metrics show cumulative count of Article Views (full-text article views including HTML views, PDF and ePub downloads, according to the available data) and Abstracts Views on Vision4Press platform.
Data correspond to usage on the plateform after 2015. The current usage metrics is available 48-96 hours after online publication and is updated daily on week days.
Initial download of the metrics may take a while.