Fig. 18.
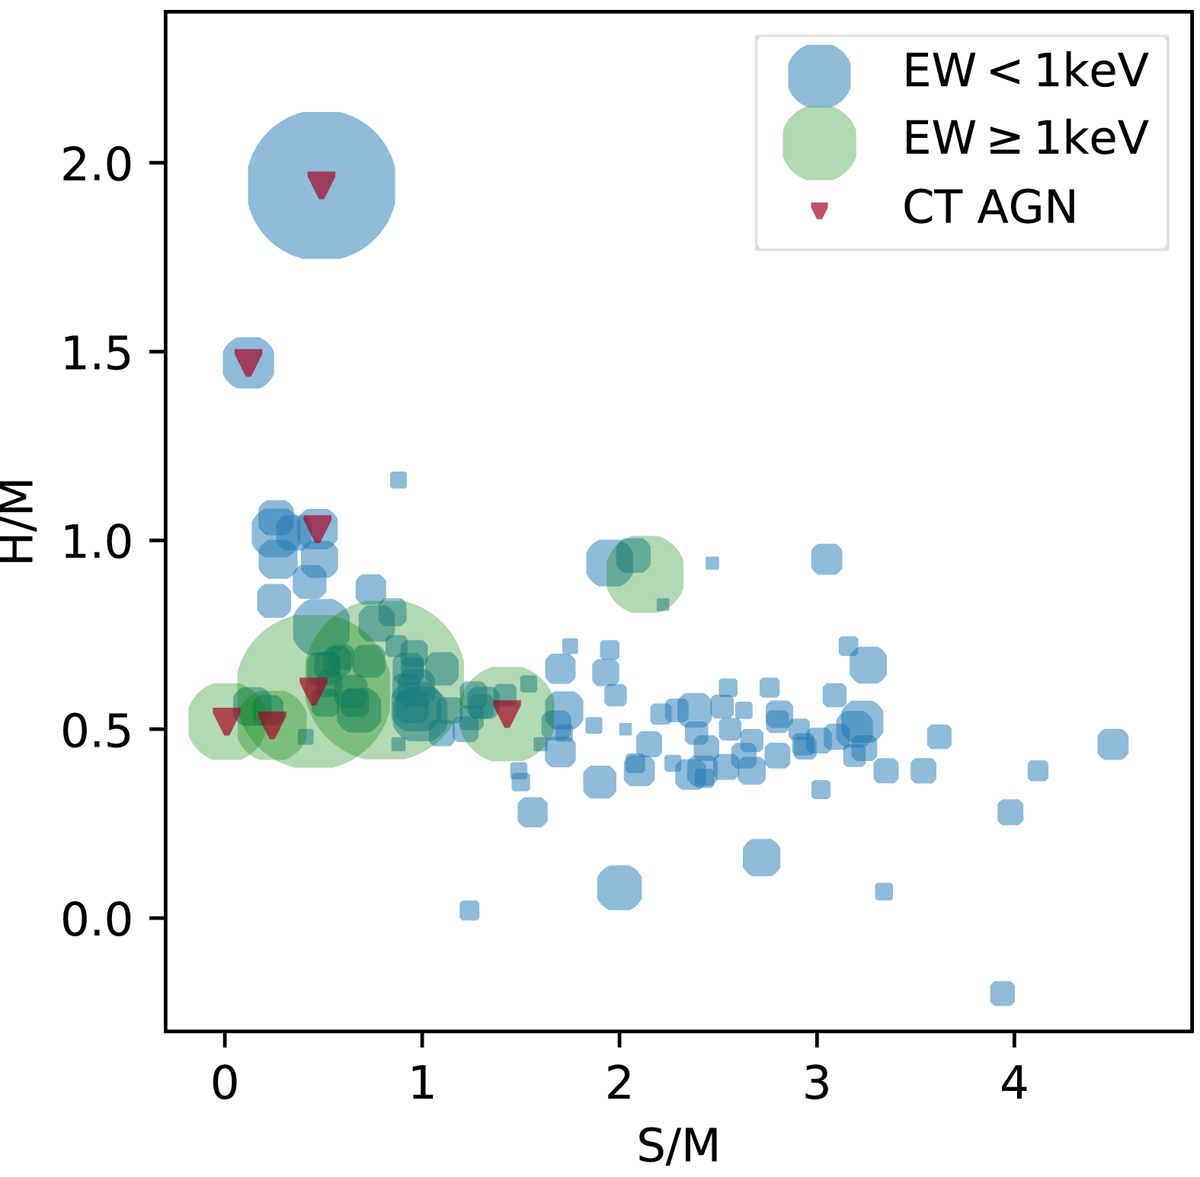
Same X-ray colour-colour diagram as Fig. 10 with information of R(Fe) added by the symbol size (the larger the size, the larger the R(Fe) value), to illustrate the Compton-thick AGN selection by the X-ray colours and R(Fe) alone (without spectral fitting). The error bars of the X-ray colours are omitted for clarity. Sources with strong Fe K lines (EW ≥ 1 keV, measured by spectral fitting) are distinguished by colour. The seven Compton thick AGN candidates are marked by red triangles. Requiring S/M < 1.5 and H/M > 0.5 ensures a hard spectrum of a reflection-dominated source.
Current usage metrics show cumulative count of Article Views (full-text article views including HTML views, PDF and ePub downloads, according to the available data) and Abstracts Views on Vision4Press platform.
Data correspond to usage on the plateform after 2015. The current usage metrics is available 48-96 hours after online publication and is updated daily on week days.
Initial download of the metrics may take a while.