Fig. 11.
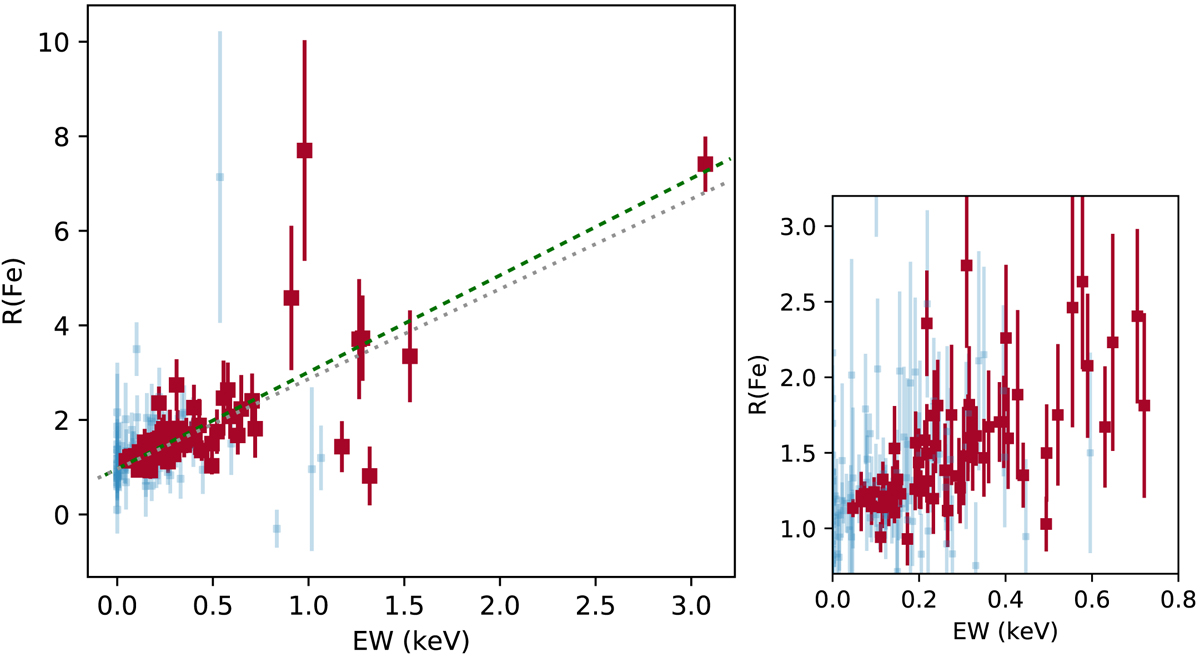
Left: Fe K line strength indicator, R(Fe), against the Fe K line equivalent width (EW) obtained from spectral fitting. The filled squares (red) show data for Fe lines with the ≥90% detection while the circles (light blue) show data for weak/no detection for the whole sample. The dashed line indicates the fitted linear correlation (see text). The dotted line indicates the expected relation when the continuum level estimate of the i = 13 bin is accurate. Right: same plot for the crowded region of EW < 0.8 keV.
Current usage metrics show cumulative count of Article Views (full-text article views including HTML views, PDF and ePub downloads, according to the available data) and Abstracts Views on Vision4Press platform.
Data correspond to usage on the plateform after 2015. The current usage metrics is available 48-96 hours after online publication and is updated daily on week days.
Initial download of the metrics may take a while.