Fig. 5
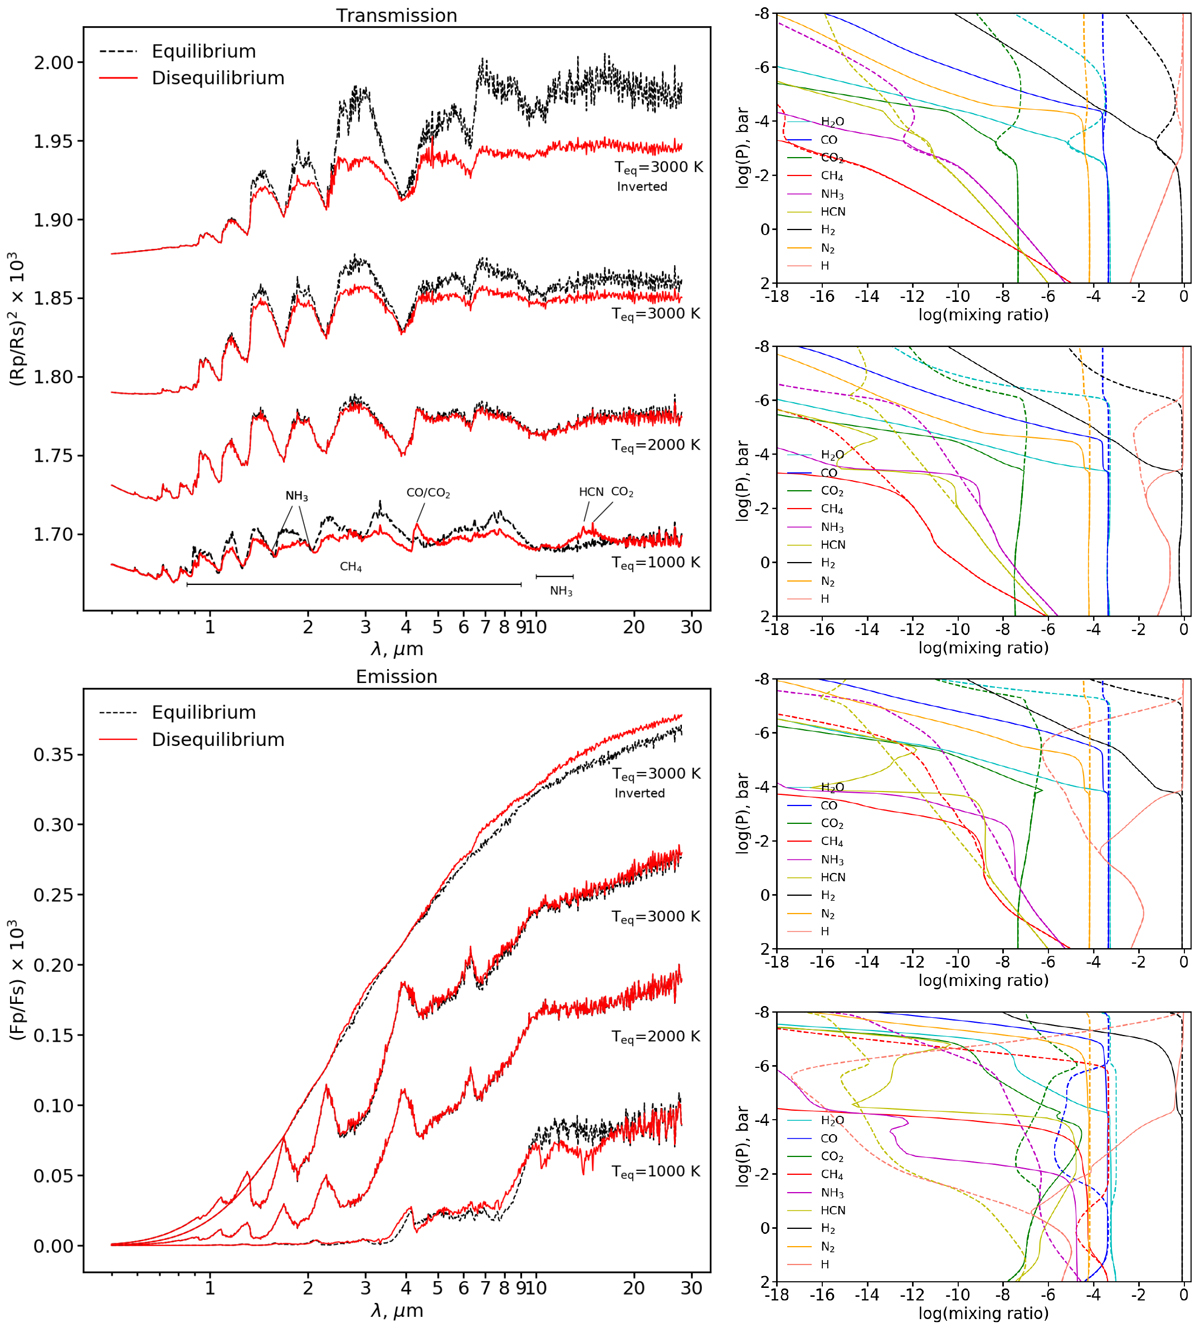
Predicted transmission (top left) and emission (bottom left) spectra calculated for the Jupiter size planet around an A0 star. From bottom to top, the spectra predicted from the four different atmospheric structures are shown. The lines denoted as “Inverted” correspond to the calculations assuming analytical T-P profile with temperature inversion (see text for details). The spectra were binned with the spectral resolution R = λ∕Δλ = 200. The transmission spectra were shifted vertically for better representation. The mixing ratios corresponding to the above-mentioned atmospheric structures are shown in the second column of the figure (from bottom to top). In all plots, the spectra and mixing ratios calculated from the equilibrium and nonequilibrium chemistry are shown with dashed and solid lines, respectively. Disequilibrium molecules responsible for absorption bands in the emission spectrum for the T1 case are explicitly labeled in the top left plot.
Current usage metrics show cumulative count of Article Views (full-text article views including HTML views, PDF and ePub downloads, according to the available data) and Abstracts Views on Vision4Press platform.
Data correspond to usage on the plateform after 2015. The current usage metrics is available 48-96 hours after online publication and is updated daily on week days.
Initial download of the metrics may take a while.