Fig. 9.
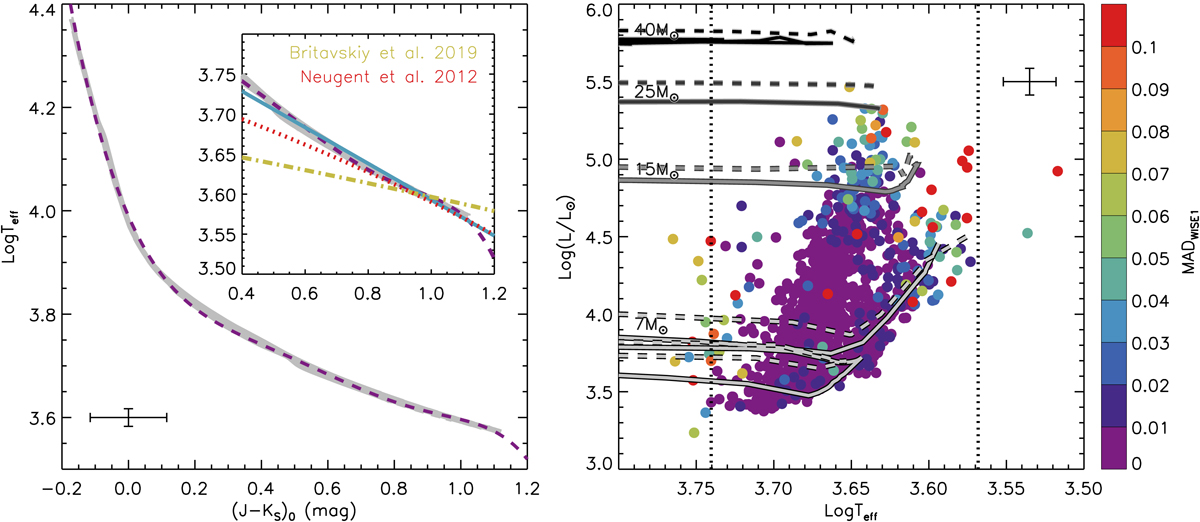
Left: Teff vs. reddening-free J − KS color ((J − KS)0) over the range of 3.57 ≤ Log Teff ≤ 4.35 and −0.16 ≤ (J − KS)0 ≤ 1.13 derived from the MIST models. A sixth-order polynomial fitting is shown as a dashed line, which works very well, except at the very red end. The inset shows the range of 3.5 ≤ Log Teff ≤ 3.8 and 0.4 ≤ (J − KS)0 ≤ 1.2, where a linear fitting is adopted shown as solid line instead of the polynomial fitting. Results from Britavskiy et al. (2019) (dash-dotted line) and Neugent et al. (2012) (dotted line) are also shown in the diagram. Our result is almost identical to that of Neugent et al. (2012) in the range of 0.8 ≤ (J − KS)0 ≤ 1.2. Right: RSG sample (color-coded with WISE1-band variability) overlapped with color-coded non-rotation (solid lines) and rotation (V/VC = 0.40; dashed lines) Geneva evolutionary tracks of 7 to 40 M⊙ at Z = 0.002. Vertical dotted lines indicate the Teff range of 3700−5700 K for the RSG sample. The vast majority of targets selected by MIST model are following the Geneva tracks, and a few outliers can be explained by the combination of variability and reddening. Error bars show the typical errors of ∼0.017 dex in Log Teff and ∼0.086 dex in Log(L/L⊙).
Current usage metrics show cumulative count of Article Views (full-text article views including HTML views, PDF and ePub downloads, according to the available data) and Abstracts Views on Vision4Press platform.
Data correspond to usage on the plateform after 2015. The current usage metrics is available 48-96 hours after online publication and is updated daily on week days.
Initial download of the metrics may take a while.