Fig. 8.
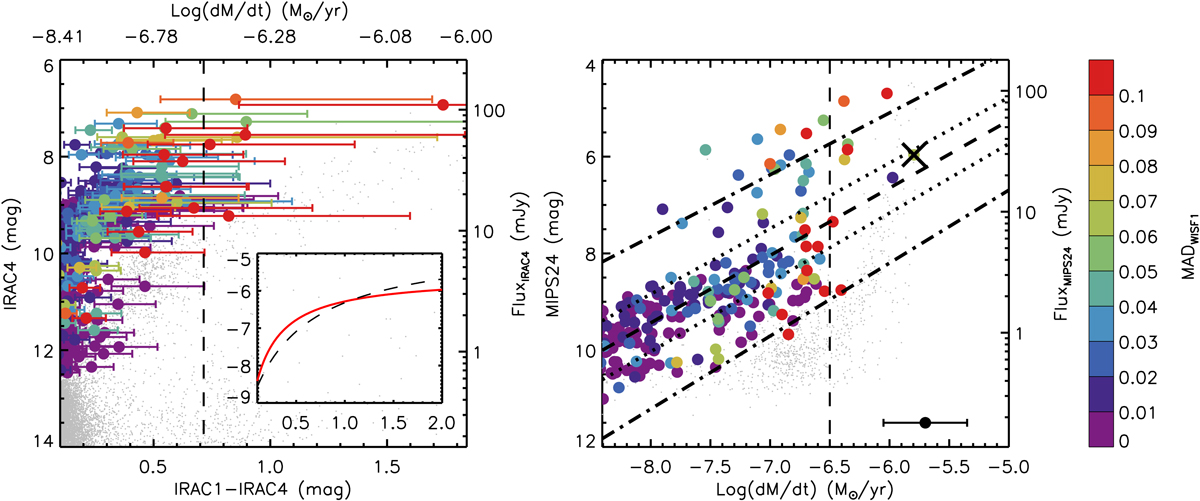
IRAC4 vs. IRAC1–IRAC4 (left) and MIPS24 vs. MLR (right) diagrams color-coded with WISE1-band variability (same below). The IRAC1–IRAC4 color is converted to the MLR by using a modified algorithm from Groenewegen & Sloan (2018), where the inset shows the comparison between the new (red solid line) and old (black dashed line) algorithms (x-axis is the IRAC1–IRAC4 color and y-axis is the MLR). The error bars show typical error of 0.35 dex. Most of the targets appear to have MLR below ∼10−6.5 M⊙ yr−1 (vertical dashed line; for convenience, two targets showing substantial MLR, e.g., > 10−6.0 M⊙ yr−1, are not shown in the IRAC4 vs. IRAC1–IRAC4 diagram). There is a linear relation (dashed line) between MIPS24 magnitude and MLR, while the dotted lines and dash-dotted lines indicate the 1σ and 3σ uncertainties, respectively. Moreover, some targets lying above the upper limit of 3σ may be related to episodic mass loss events during the RSGs phase.
Current usage metrics show cumulative count of Article Views (full-text article views including HTML views, PDF and ePub downloads, according to the available data) and Abstracts Views on Vision4Press platform.
Data correspond to usage on the plateform after 2015. The current usage metrics is available 48-96 hours after online publication and is updated daily on week days.
Initial download of the metrics may take a while.