Fig. 6.
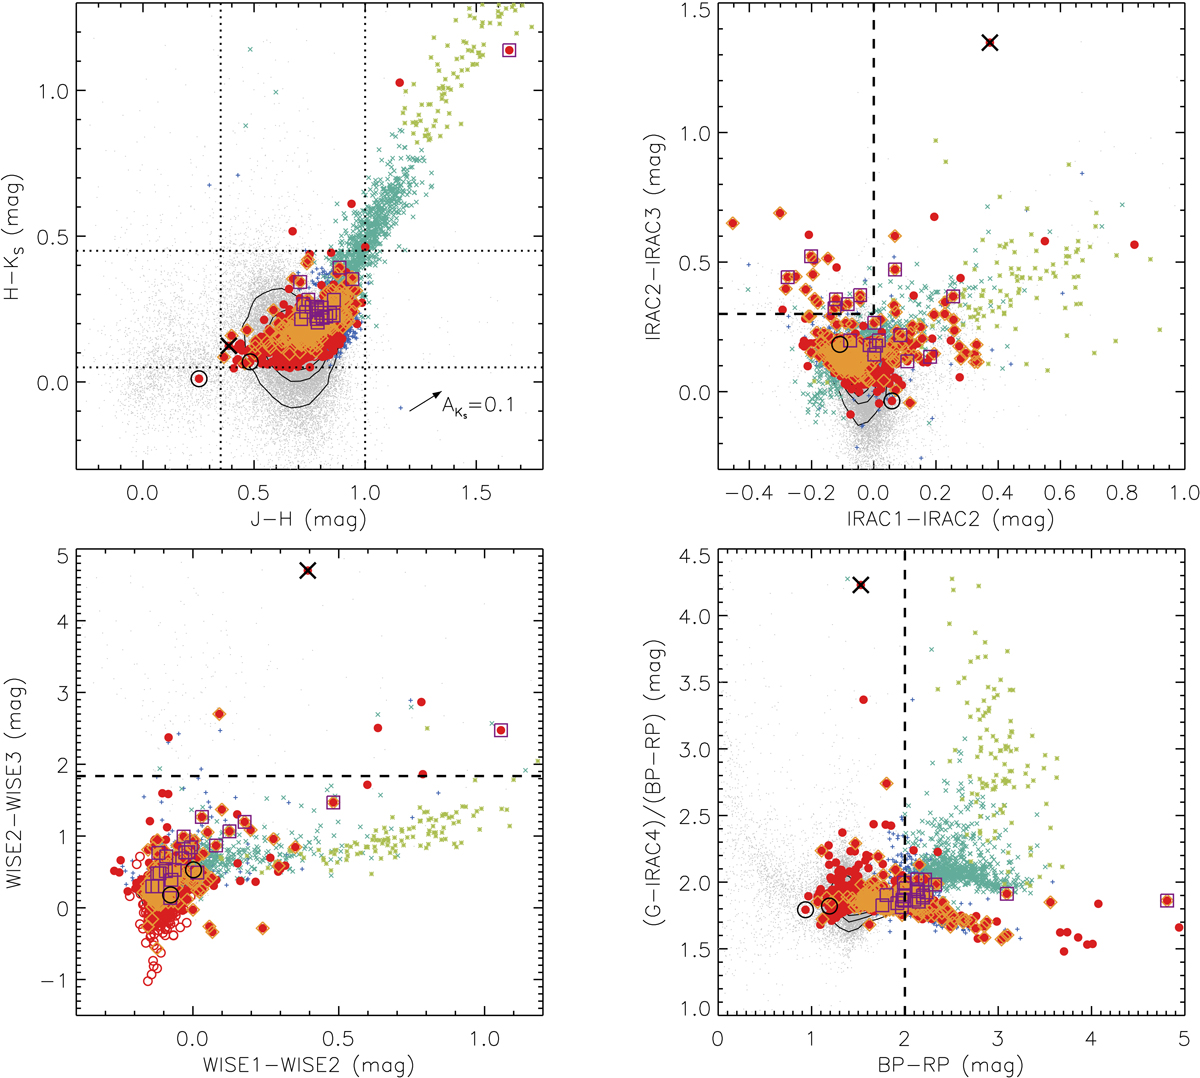
Upper left: 2MASS CCD of J − H vs. H − KS. The RSGs population is clumping within the range of 0.35 ≲ J − H ≲ 1.0 and 0.05 ≲ H − KS ≲ 0.45 (dotted lines), and is indistinguishable from the O-AGBs. Upper right: IRAC CCD of IRAC1–IRAC2 vs. IRAC2–IRAC3. The previously defined PAH emission region of IRAC1 − IRAC2 ≤ 0 and IRAC2 − IRAC3 ≥ 0.3 is shown as dashed lines (Yang et al. 2018). There are only about only about 4% (after correcting for the completeness) of RSG candidates that show PAH emission features. Bottom left: WISE CCD of WISE1–WISE2 vs. WISE2–WISE3. The horizontal dashed line indicates Fν, WISE2 = Fν, WISE3 (WISE2 − WISE3 = 1.84), for which there are only seven targets above it. Bottom right: optical-MIR color excesses of BP − RP vs. (G − IRAC4)/(BP − RP). RSG candidates (and O-AGBs), C-AGBs, and x-AGBs having lowest, moderate, and highest ratio of (G − IRAC4)/(BP − RP) at BP − RP ≥ 2.0 (vertical dashed line), respectively.
Current usage metrics show cumulative count of Article Views (full-text article views including HTML views, PDF and ePub downloads, according to the available data) and Abstracts Views on Vision4Press platform.
Data correspond to usage on the plateform after 2015. The current usage metrics is available 48-96 hours after online publication and is updated daily on week days.
Initial download of the metrics may take a while.