Fig. 5.
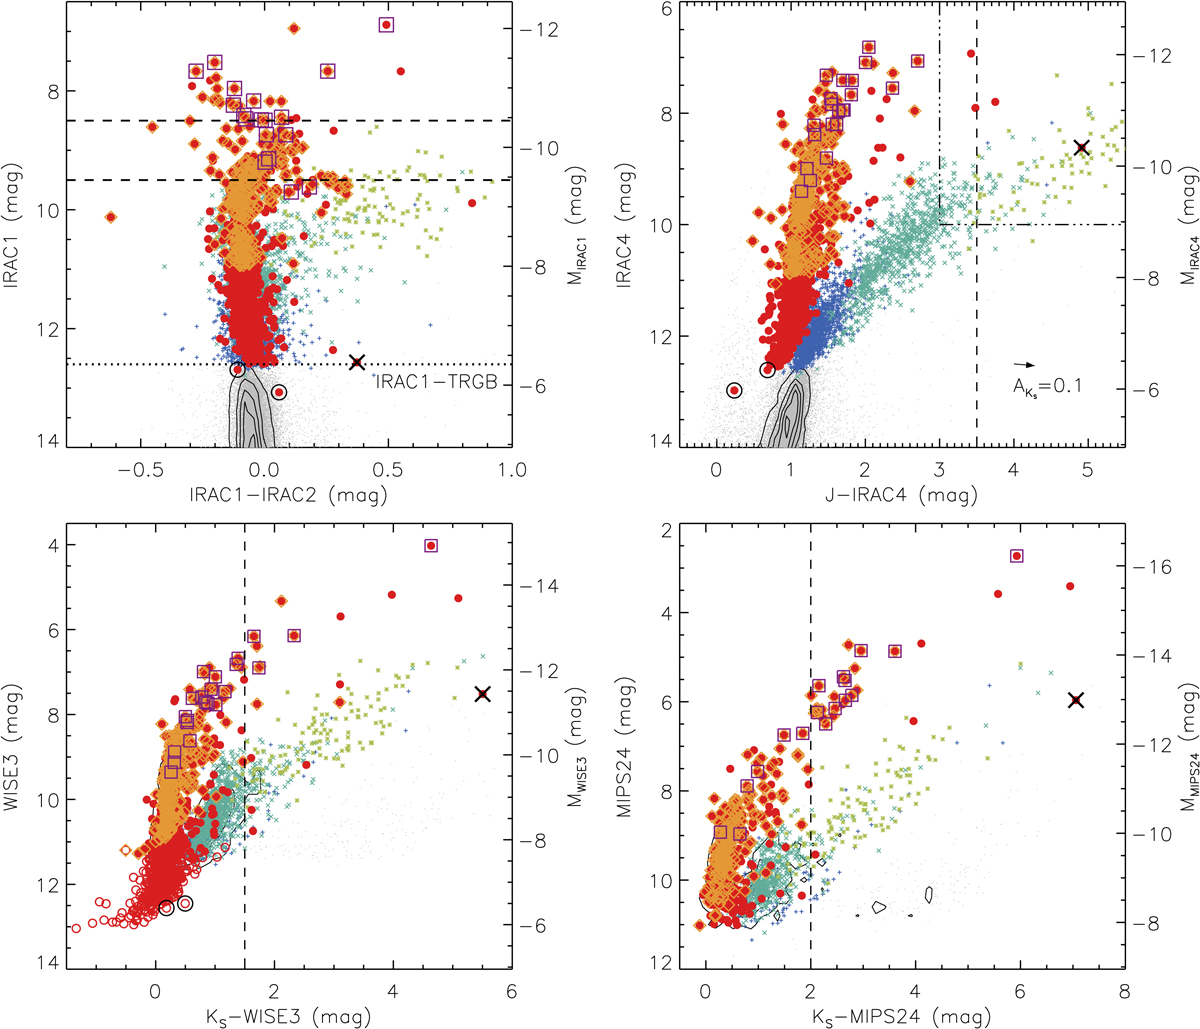
Upper left: IRAC1 vs. IRAC1–IRAC2 diagram. The RSG sample mainly shows negative value of IRAC1–IRAC2 due to the CO absorption around 4.6 μm. In particular, it turns bluewards (IRAC1 ≳ 9.5 mag) with CO absorption, redwards (8.5 ≲ IRAC1 ≲ 9.5) with enhanced mass loss due to both luminosity and variability, and again bluewards (IRAC1 ≲ 8.5) with PAH emission, along with the increasing of luminosity. There is another fainter branch (9.3 ≲ IRAC1 ≲ 10.0 mag and 0 ≲ IRAC1 − IRAC2 ≲ 0.35 mag) extended to the x-AGBs region with unknown origin. Upper right: IRAC4 vs. J − IRAC4 diagram. The dash-dotted lines region indicates the selection criteria for the obscured target. Bottom left: WISE3 vs. KS − WISE3 diagram. For clarity, RSG candidates with S/NWISE3 < 10 are shown as red open circles, while background targets from SMC source catalog with S/NWISE3 < 10 are not shown in the diagram. The RSGs population shows redder color of J − IRAC4 and KS − WISE3 along with the increasing of IRAC4/WISE3 luminosity. Bottom right: MIPS24 vs. KS − MIPS24 diagram. The majority of the MIPS24 detected targets are also spectroscopic RSGs. The brightest RSGs candidates form a parallel sequence with respect to the x-AGBs population. The vertical dashed lines indicate the approximate blue boundaries of x-AGBs. See text for details.
Current usage metrics show cumulative count of Article Views (full-text article views including HTML views, PDF and ePub downloads, according to the available data) and Abstracts Views on Vision4Press platform.
Data correspond to usage on the plateform after 2015. The current usage metrics is available 48-96 hours after online publication and is updated daily on week days.
Initial download of the metrics may take a while.