Fig. 4.
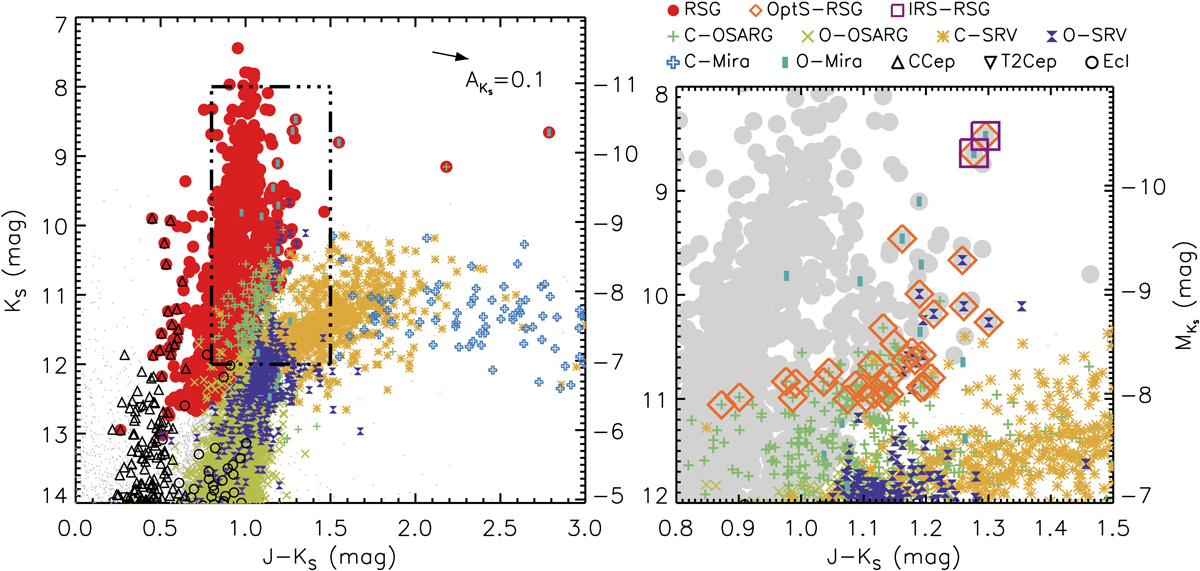
Right panel: same diagram as Fig. 3, but with variable classifications from OGLE. Different types of variables are shown as different symbols. An overlapping of OSARGs, SRVs, and Miras can be seen in the lower half of the zoomed-out region. Left panel: same zoomed-out region as Fig. 3, where 24 C-OSARGs, 7 O-SRVs, and 3 O-Miras are optical spectroscopic RSGs (open diamonds). More interestingly, two O-Miras at the upper right are classified as both optical and MIR spectroscopic RSGs (open squares).
Current usage metrics show cumulative count of Article Views (full-text article views including HTML views, PDF and ePub downloads, according to the available data) and Abstracts Views on Vision4Press platform.
Data correspond to usage on the plateform after 2015. The current usage metrics is available 48-96 hours after online publication and is updated daily on week days.
Initial download of the metrics may take a while.