Fig. 3.
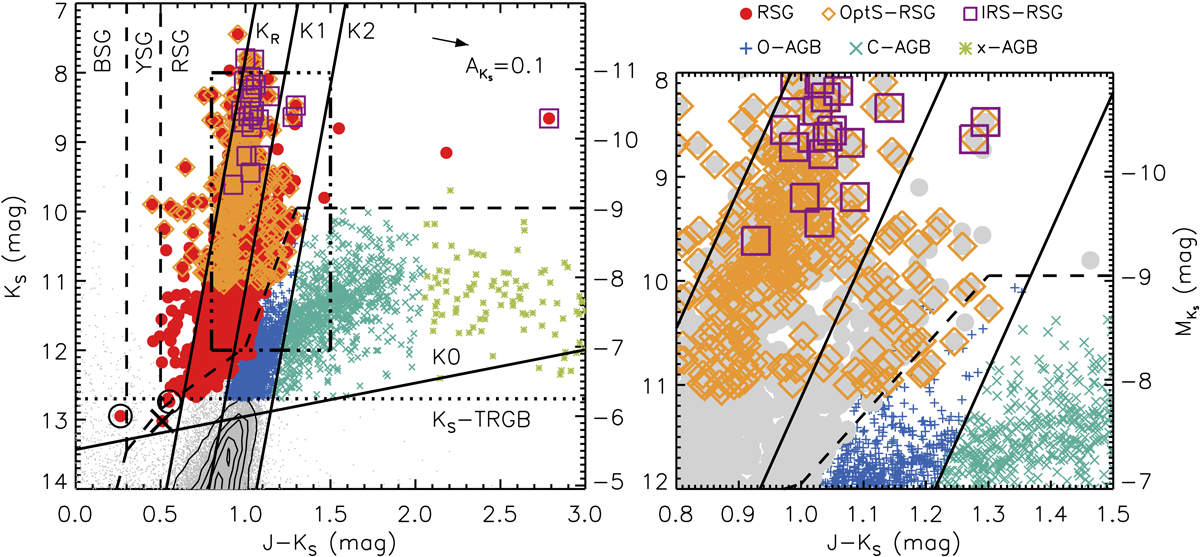
KS vs. J − KS CMDs showing RSG and AGB candidates. Left panel: targets from the SMC source catalog are shown as gray dots with contours indicating the number density (same below), while the 1242 RSGs candidates are shown as solid circles. The O-AGB (pluses), C-AGB (crosses), x-AGB (asterisks), and RSG populations defined by theoretical J − KS color cuts are separated by K0, K1, K2, and KR lines (solid lines), respectively (same below). The regions of BSG, YSG, and RSG populations defined by the MIST models are separated by the dashed lines. The optical and MIR spectroscopic RSGs are shown as open diamonds and open squares, respectively, and only represent about 25% of the whole RSG population. A reddening vector of AKS = 0.1 mag is shown as a reference. Two targets both fainter than the KS-TRGB (KS ≈ 12.7 mag; dotted line) and IRAC1-TRGB (IRAC1 ≈ 12.6 mag) are excluded from the RSG sample, and are marked as big open circles. One heavily obscured target is shown as big cross (same below). The zoomed-out region is indicated by dash-doted lines. Right panel: zoomed-out region of 8.0 ≤ KS ≤ 12.0 mag and 0.8 ≤ J − KS ≤ 1.5 mag, where the distribution of the optical spectroscopic RSGs at the red end follows almost exactly the MIST tracks. See text for details.
Current usage metrics show cumulative count of Article Views (full-text article views including HTML views, PDF and ePub downloads, according to the available data) and Abstracts Views on Vision4Press platform.
Data correspond to usage on the plateform after 2015. The current usage metrics is available 48-96 hours after online publication and is updated daily on week days.
Initial download of the metrics may take a while.