Fig. 10.
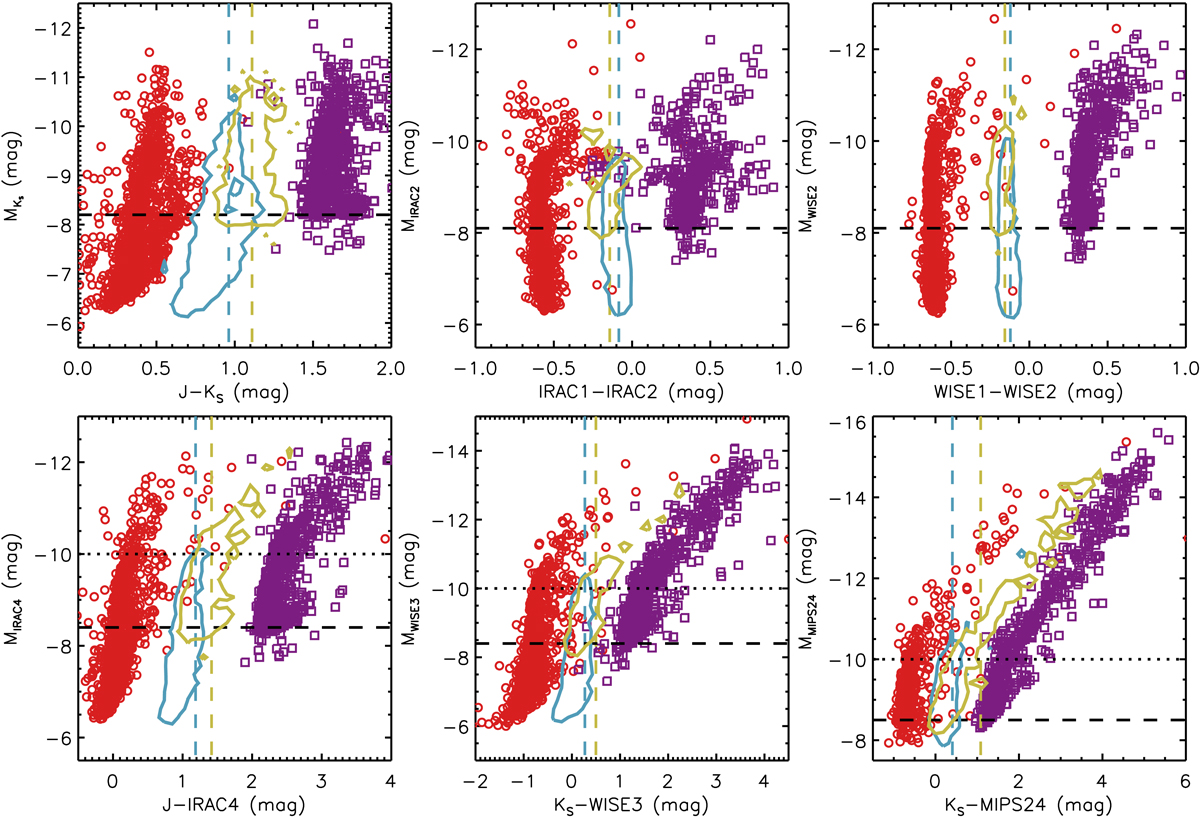
CMDs of MKS vs. J − KS (upper left), MIRAC2 vs. IRAC1–IRAC2 (upper middle), MWISE2 vs. WISE1–WISE2 (upper right), MIRAC4 vs. J − IRAC4 (bottom left), MWISE3 vs. KS − WISE3 (bottom middle), and MMIPS24 vs. KS − MIPS24 (bottom right). Targets with upper limits are not shown in the diagrams (same below). Red open circles and purple open squares indicate the targets from the SMC and the LMC samples, while the blue and yellow contours indicate 10% number density of each sample (same below), respectively. There are offsets of −0.5 mag (upper row) and −1.0 mag (bottom row) for the color indexes of the SMC sample, and offsets of +0.5 mag and +1.0 mag for the LMC sample, respectively (contours are not offset; same below). The vertical dashed lines indicate the median values of each color index (blue for the SMC and yellow for the LMC) with the same limiting magnitudes in both the SMC and the LMC (horizontal dashed lines). The LMC sample is not magnitude-completed and lack of a large number of fainter and bluer targets. The differences of color indexes between the SMC and the LMC are listed in Table 3. Even though the LMC sample is less complete, it still contains more dusty targets (< − 10.0 mag; horizontal dotted lines) than the SMC sample at the longer wavelengths.
Current usage metrics show cumulative count of Article Views (full-text article views including HTML views, PDF and ePub downloads, according to the available data) and Abstracts Views on Vision4Press platform.
Data correspond to usage on the plateform after 2015. The current usage metrics is available 48-96 hours after online publication and is updated daily on week days.
Initial download of the metrics may take a while.