Fig. 1.
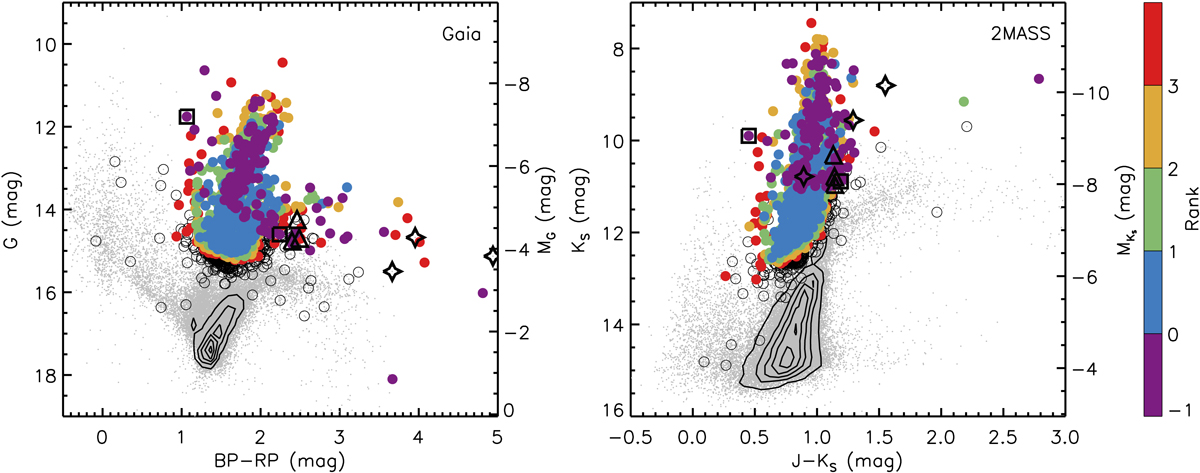
Color-magnitude diagrams of Gaia and 2MASS datasets. Targets from the SMC source catalog are shown as gray dots. The valid RSG candidates are shown as solid circles and are color-coded ranging from Rank −1 to 3. Three Rank 4 spectroscopic RSGs are shown as open triangles, while the other three Rank 4 CMD RSG candidates are shown as open stars. Two unselected spectroscopic RSGs are shown as open squares. The rest of Rank 4 and 5 targets from the main RSG sample are shown as open circles. Black contours represent the number density of the SMC source catalog. See text for details.
Current usage metrics show cumulative count of Article Views (full-text article views including HTML views, PDF and ePub downloads, according to the available data) and Abstracts Views on Vision4Press platform.
Data correspond to usage on the plateform after 2015. The current usage metrics is available 48-96 hours after online publication and is updated daily on week days.
Initial download of the metrics may take a while.