Fig. 9
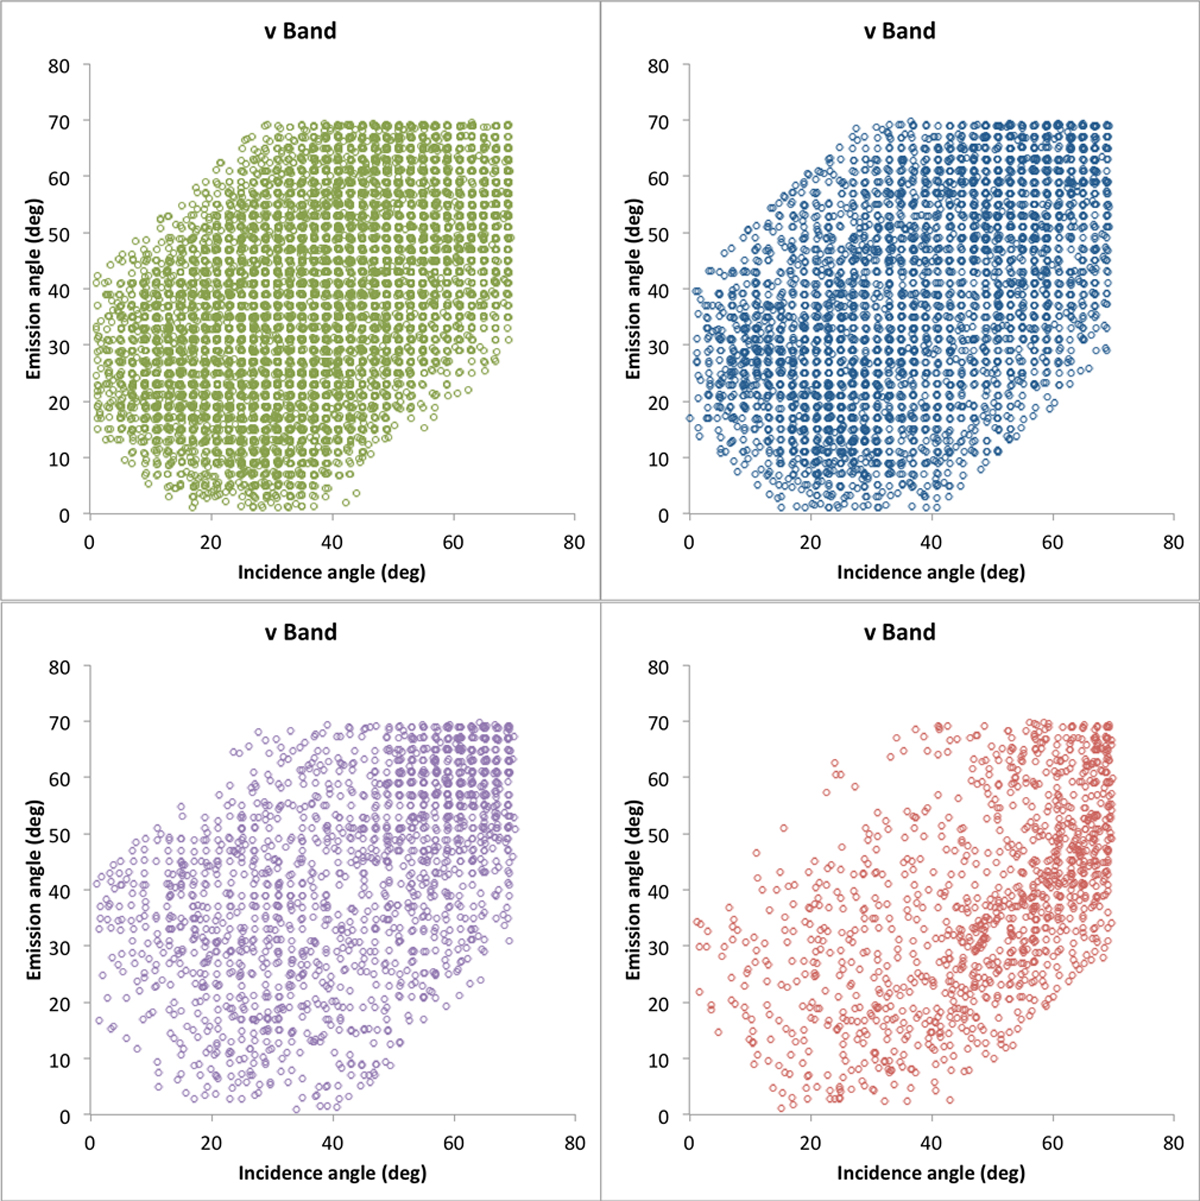
Distribution of data over the incidence and emission angle space for each of the ratio categories for the v band. The points plotted in green are those that the model fits to <5% difference. The points plotted in blue are those that are fit to between 5 and 10%. The points plotted in purple are those that are fit to between 10 and 20%, and the points in red are those that fit to >20%. The data that are modeled to within 5% are evenly distributed across the angle space. As the model agreement with the data decreases, the distribution moves to the edges of the angle space. This corresponds to regions of higher incidence and emission angle values.
Current usage metrics show cumulative count of Article Views (full-text article views including HTML views, PDF and ePub downloads, according to the available data) and Abstracts Views on Vision4Press platform.
Data correspond to usage on the plateform after 2015. The current usage metrics is available 48-96 hours after online publication and is updated daily on week days.
Initial download of the metrics may take a while.