Fig. 8
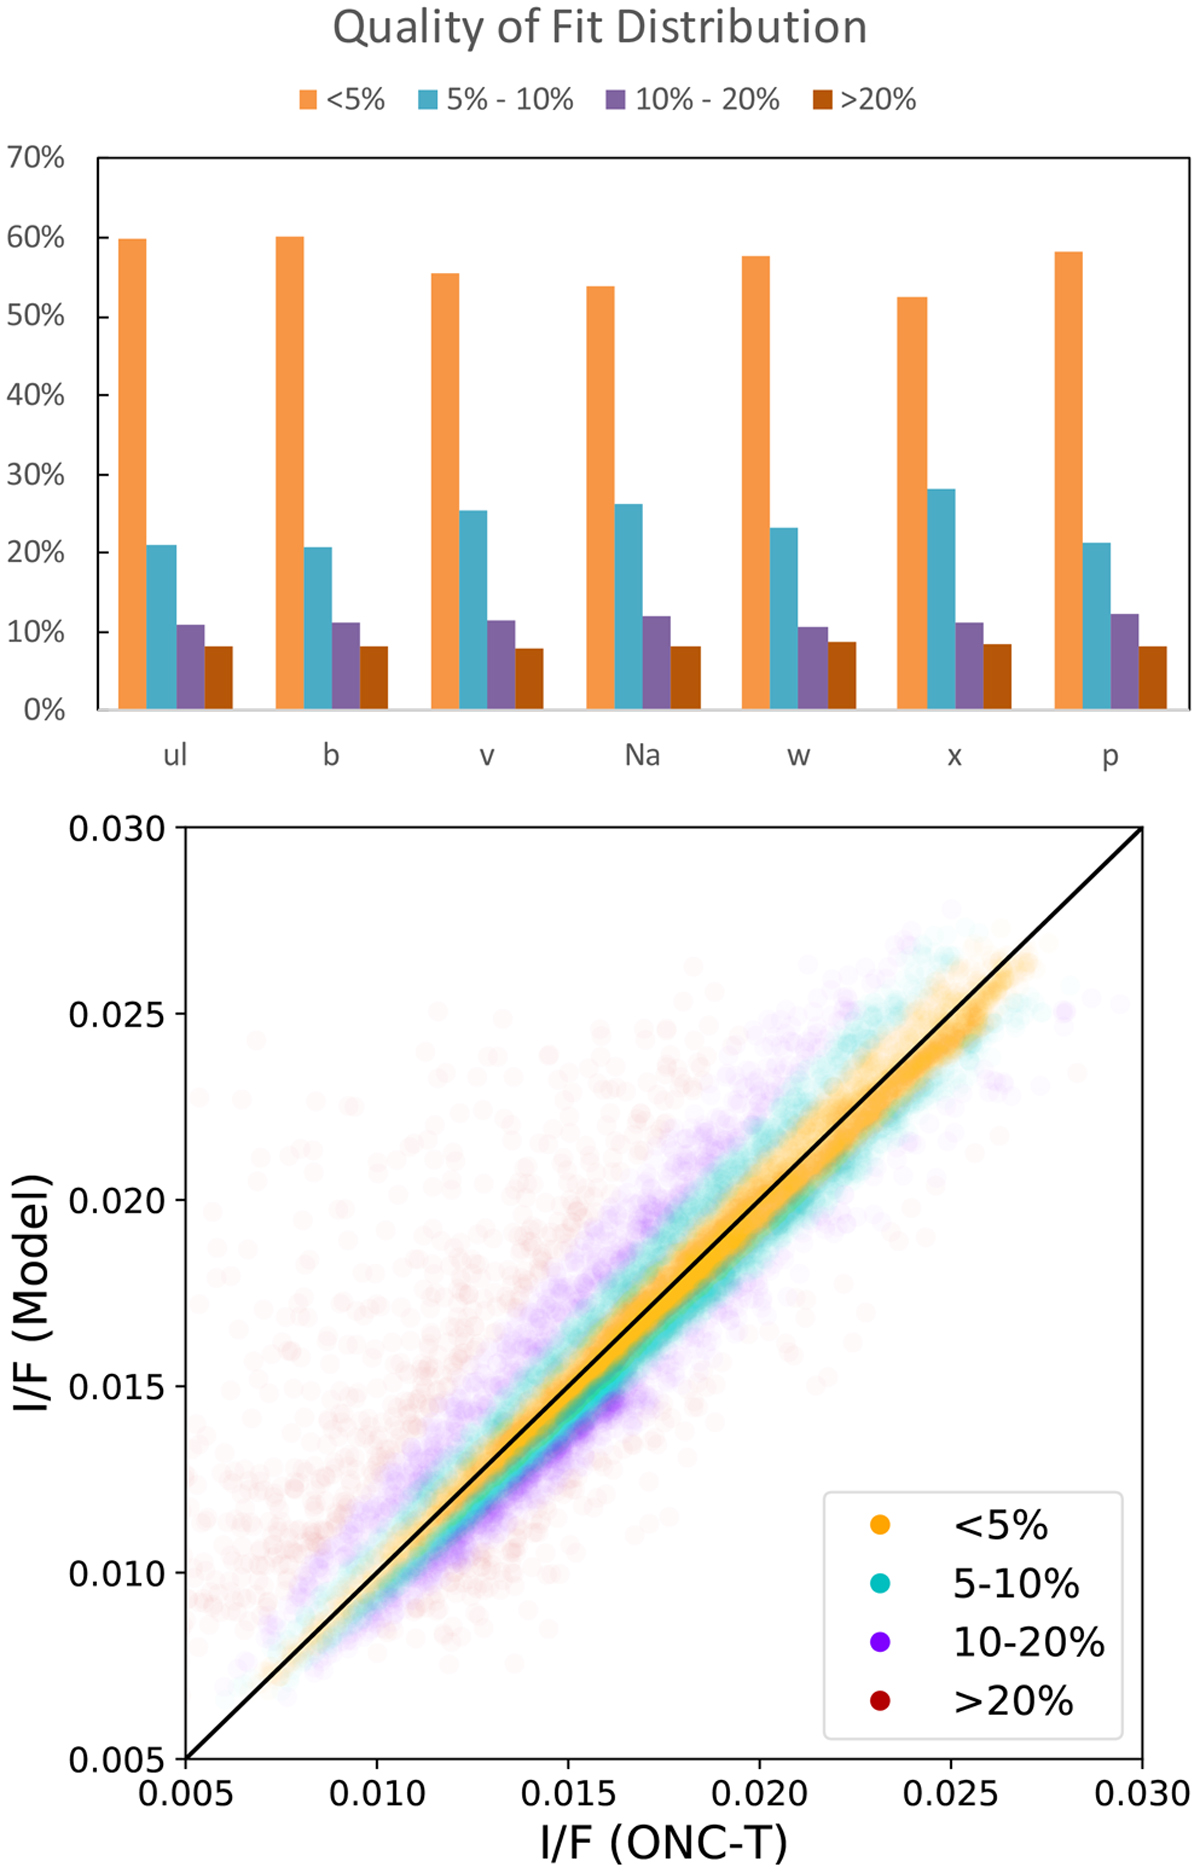
Top: percentage of the disk-resolved data set for each band that is predicted by the Hapke model solution to within <5% (orange), to within 5–10% (light blue), to within 10–20% (purple), and to within >20% (red). Bottom: comparison of the ONC-T reflectance versus the model predicted reflectance, color-coded to match the percentage bins in the top graph, for the v band. The distribution and relationship is similar for the other bands.
Current usage metrics show cumulative count of Article Views (full-text article views including HTML views, PDF and ePub downloads, according to the available data) and Abstracts Views on Vision4Press platform.
Data correspond to usage on the plateform after 2015. The current usage metrics is available 48-96 hours after online publication and is updated daily on week days.
Initial download of the metrics may take a while.