Fig. 15
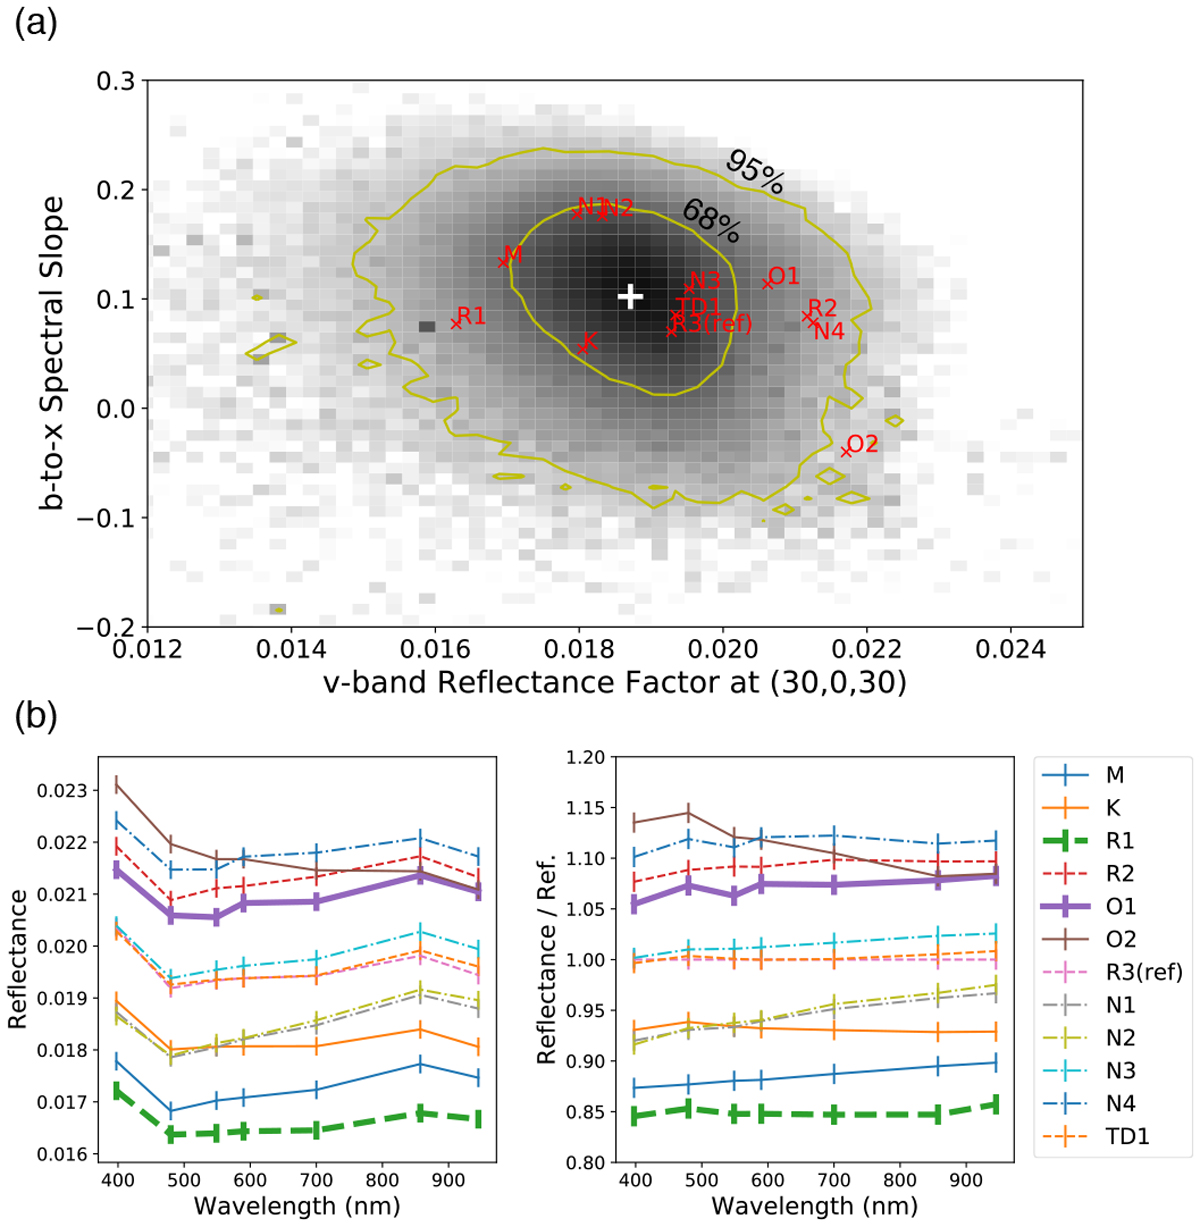
(a) Global distribution of spectral slope (b-x) and reflectance factor. The white cross indicates the median value of the entire Ryugu surface. Yellow lines indicate the 65 and 95% distribution of all pixels. crosses indicate the 12 local spectral features. (b) Photometrically standardized spectra of the 12 regions shown in Figs. 12–14. The spectra on the right are divided by the spectrum of R3 to emphasize the variations.
Current usage metrics show cumulative count of Article Views (full-text article views including HTML views, PDF and ePub downloads, according to the available data) and Abstracts Views on Vision4Press platform.
Data correspond to usage on the plateform after 2015. The current usage metrics is available 48-96 hours after online publication and is updated daily on week days.
Initial download of the metrics may take a while.