Fig. 8.
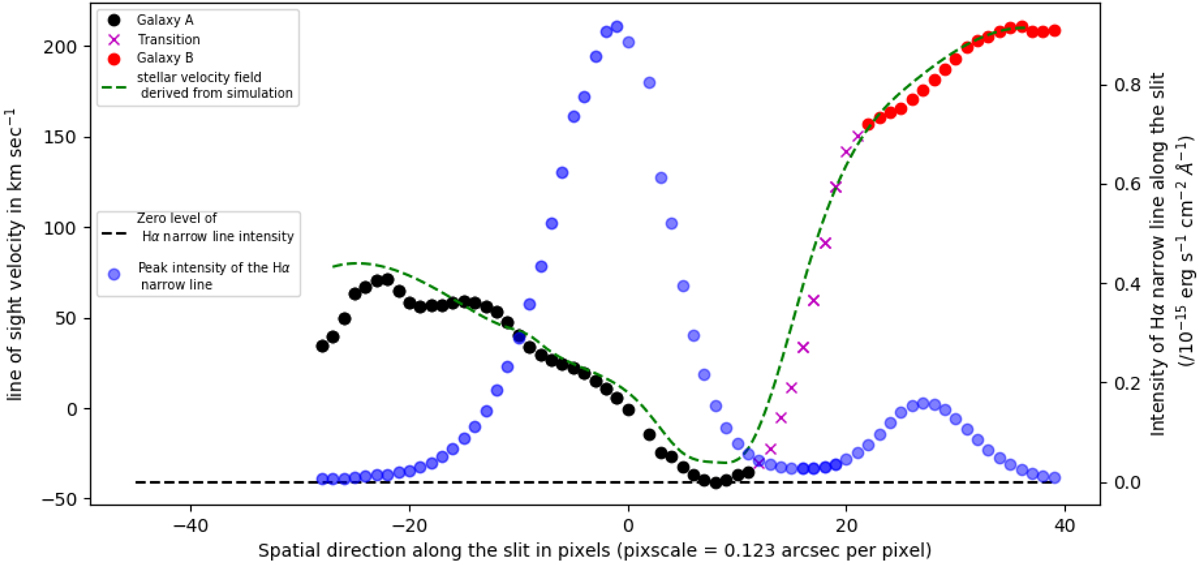
Line-of-sight velocity in km s−1 calculated from the Hα narrow line vs the radial distance from the centre of nucleus A in pixels. The pixel scale is 0.123 arcsec per pixel. Overplotted is the intensity profile of the Hα narrow line. The black dashed line represents the intensity = 0 level for the Hα line. The zero of the x-axis represents the point of highest intensity of the Hα narrow line. The dashed green line represents the stellar velocity field derived from our simulations explained in Sect. 5.3.2.
Current usage metrics show cumulative count of Article Views (full-text article views including HTML views, PDF and ePub downloads, according to the available data) and Abstracts Views on Vision4Press platform.
Data correspond to usage on the plateform after 2015. The current usage metrics is available 48-96 hours after online publication and is updated daily on week days.
Initial download of the metrics may take a while.