Fig. 4.
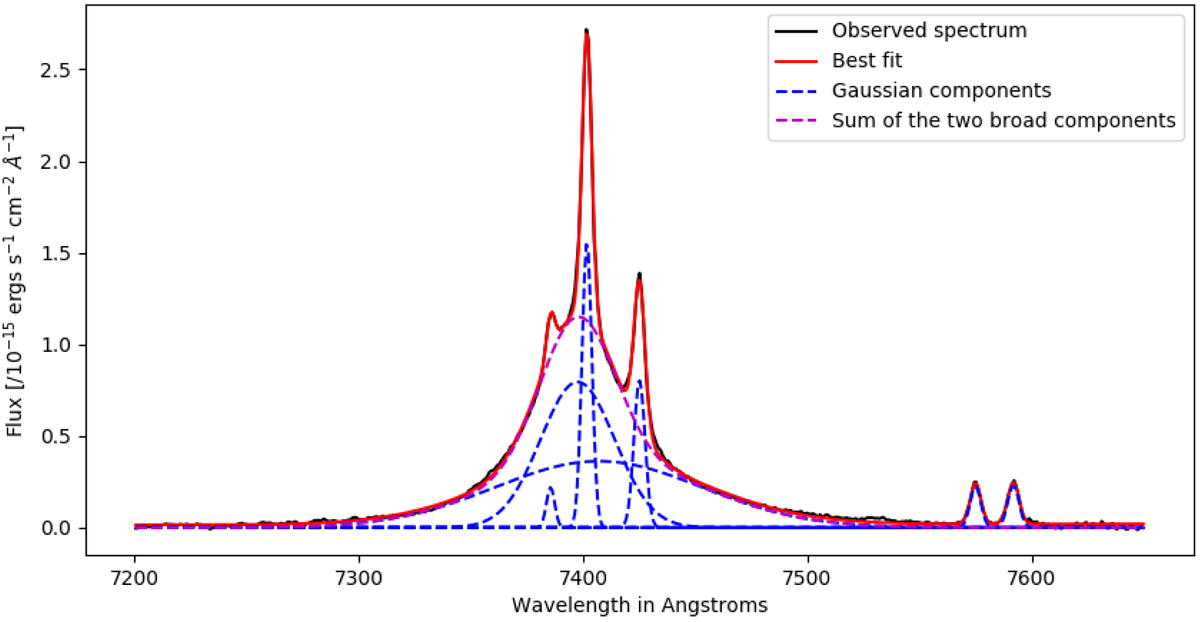
One-dimensional observed optical spectrum in the wavelength range 7200−7650 Å of SDSS J134420.86 + 663717.8 nucleus A overlaid with the Gaussian fits. Two broad components along with three narrow components are fit to the Hα + N II complex. The black line represents the observed spectrum, the red line is the best fit, the dotted blue lines are the individual Gaussian components, and the dotted magenta line is the sum of the two broad components. The wavelength axis depicts the observed wavelength.
Current usage metrics show cumulative count of Article Views (full-text article views including HTML views, PDF and ePub downloads, according to the available data) and Abstracts Views on Vision4Press platform.
Data correspond to usage on the plateform after 2015. The current usage metrics is available 48-96 hours after online publication and is updated daily on week days.
Initial download of the metrics may take a while.