Fig. 11.
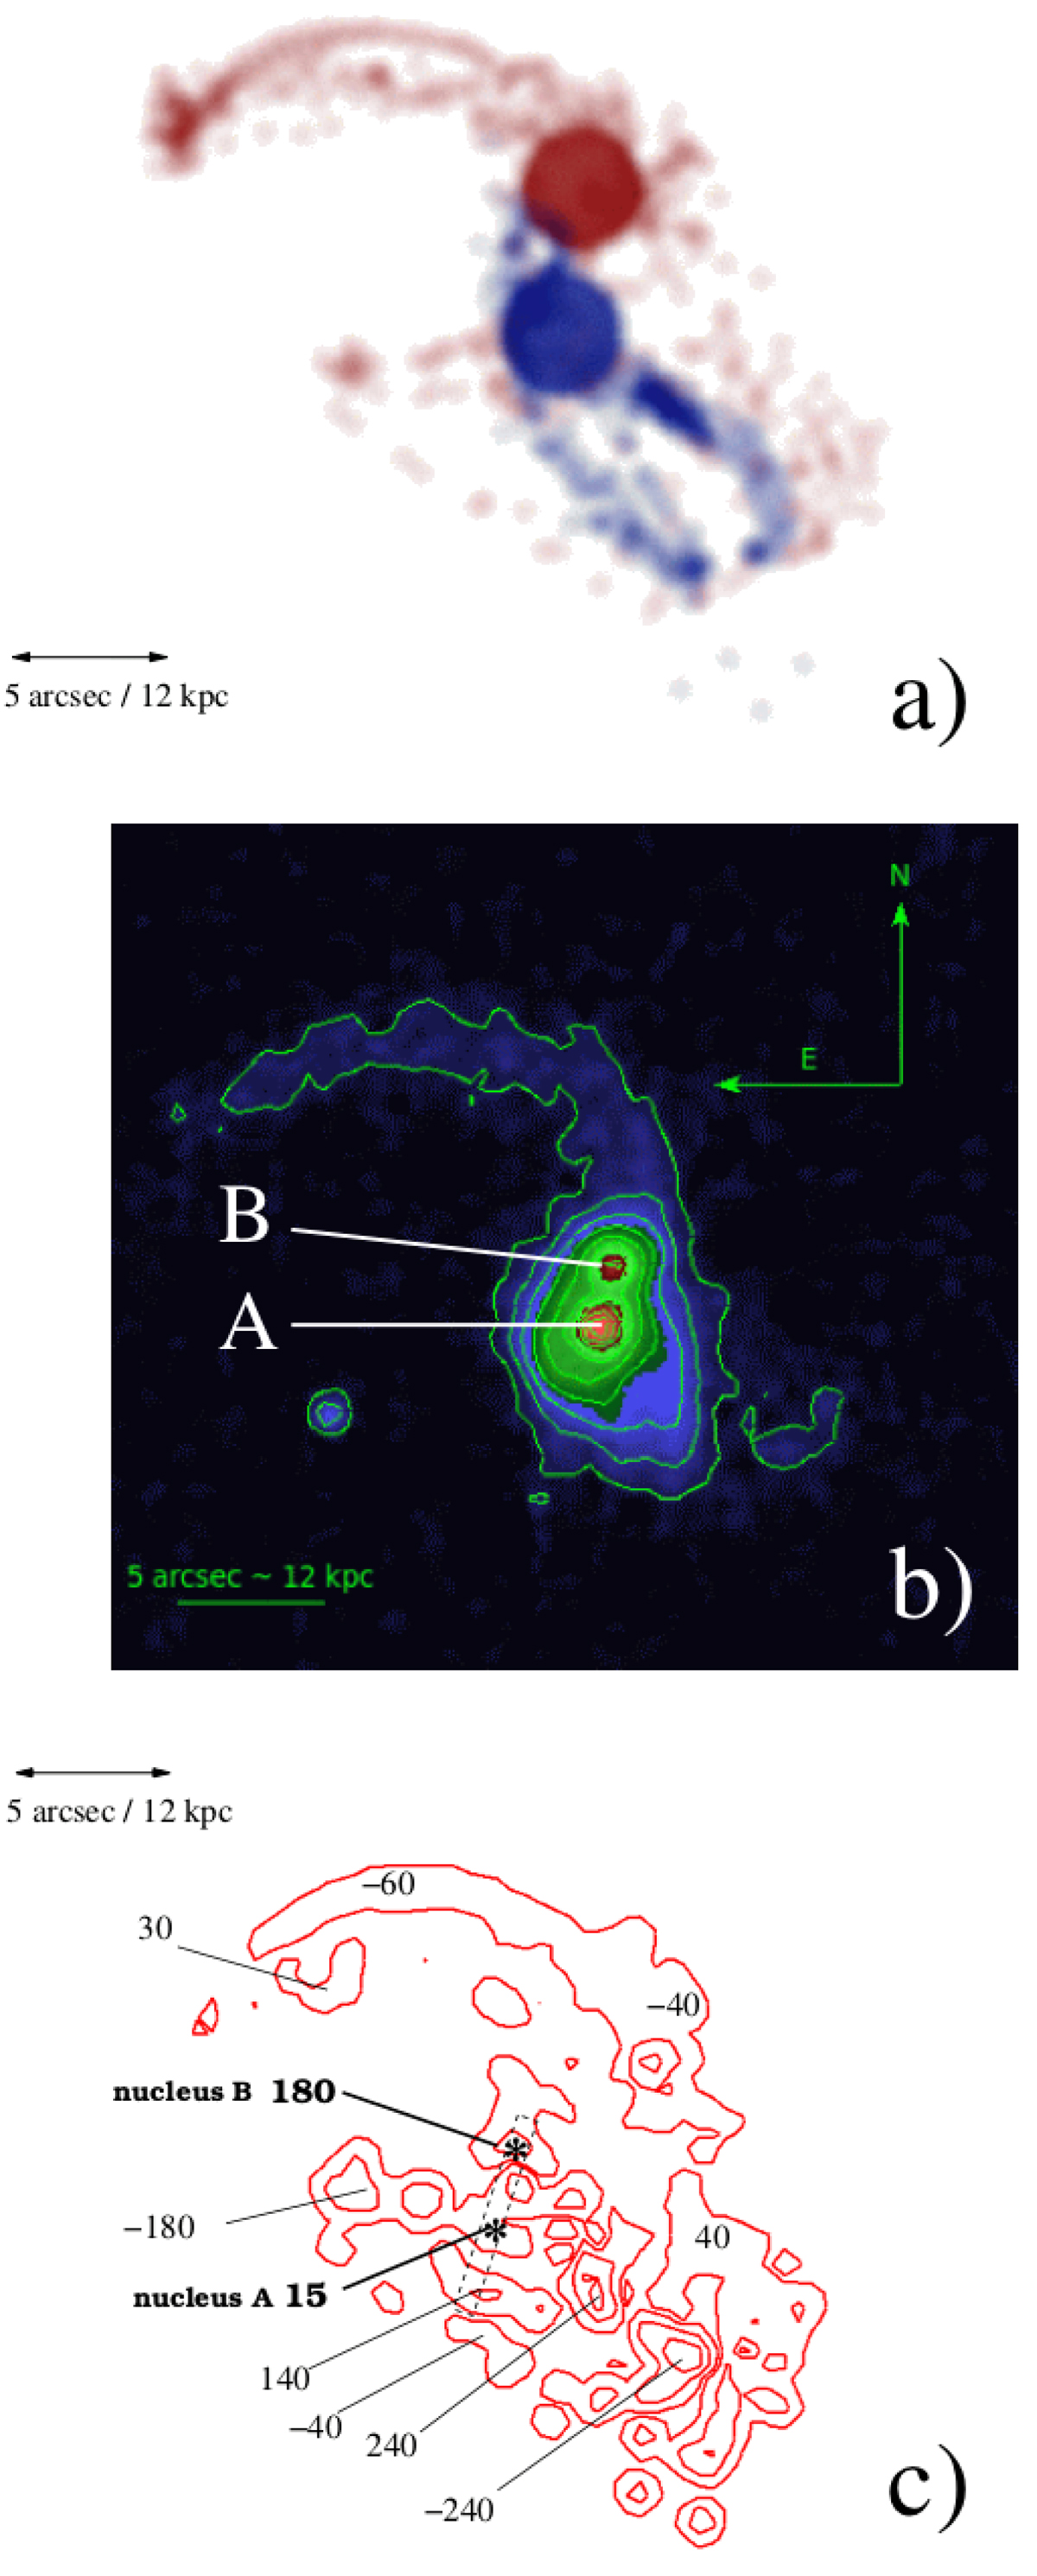
Comparison of the SDSS image of the galaxies with the result of the simulation. Top panel a: model obtained using our N-body simulation with the general region of nucleus A (blue) and B (blue) highlighted. Middle panel b: optical SDSS image of galaxies SDSS J134420.86+663717.8, superimposed with contours starting at 10% in steps of 10%. Comparison of the two figures shows striking similarities in their morphology, especially in the shapes of the two tidal arms. Bottom panel c: at an angular resolution of about 1 arcsec, we show a smoothed velocity map obtained from the simulated data cubes. Contour levels are −200, −100, −20, 20, 100, 200 km s−1. The dashed rectangular box shows the aperture along which the velocities used to plot the dashed green lines in the rotation curve in Fig. 8 were extracted.
Current usage metrics show cumulative count of Article Views (full-text article views including HTML views, PDF and ePub downloads, according to the available data) and Abstracts Views on Vision4Press platform.
Data correspond to usage on the plateform after 2015. The current usage metrics is available 48-96 hours after online publication and is updated daily on week days.
Initial download of the metrics may take a while.