Fig. 3.
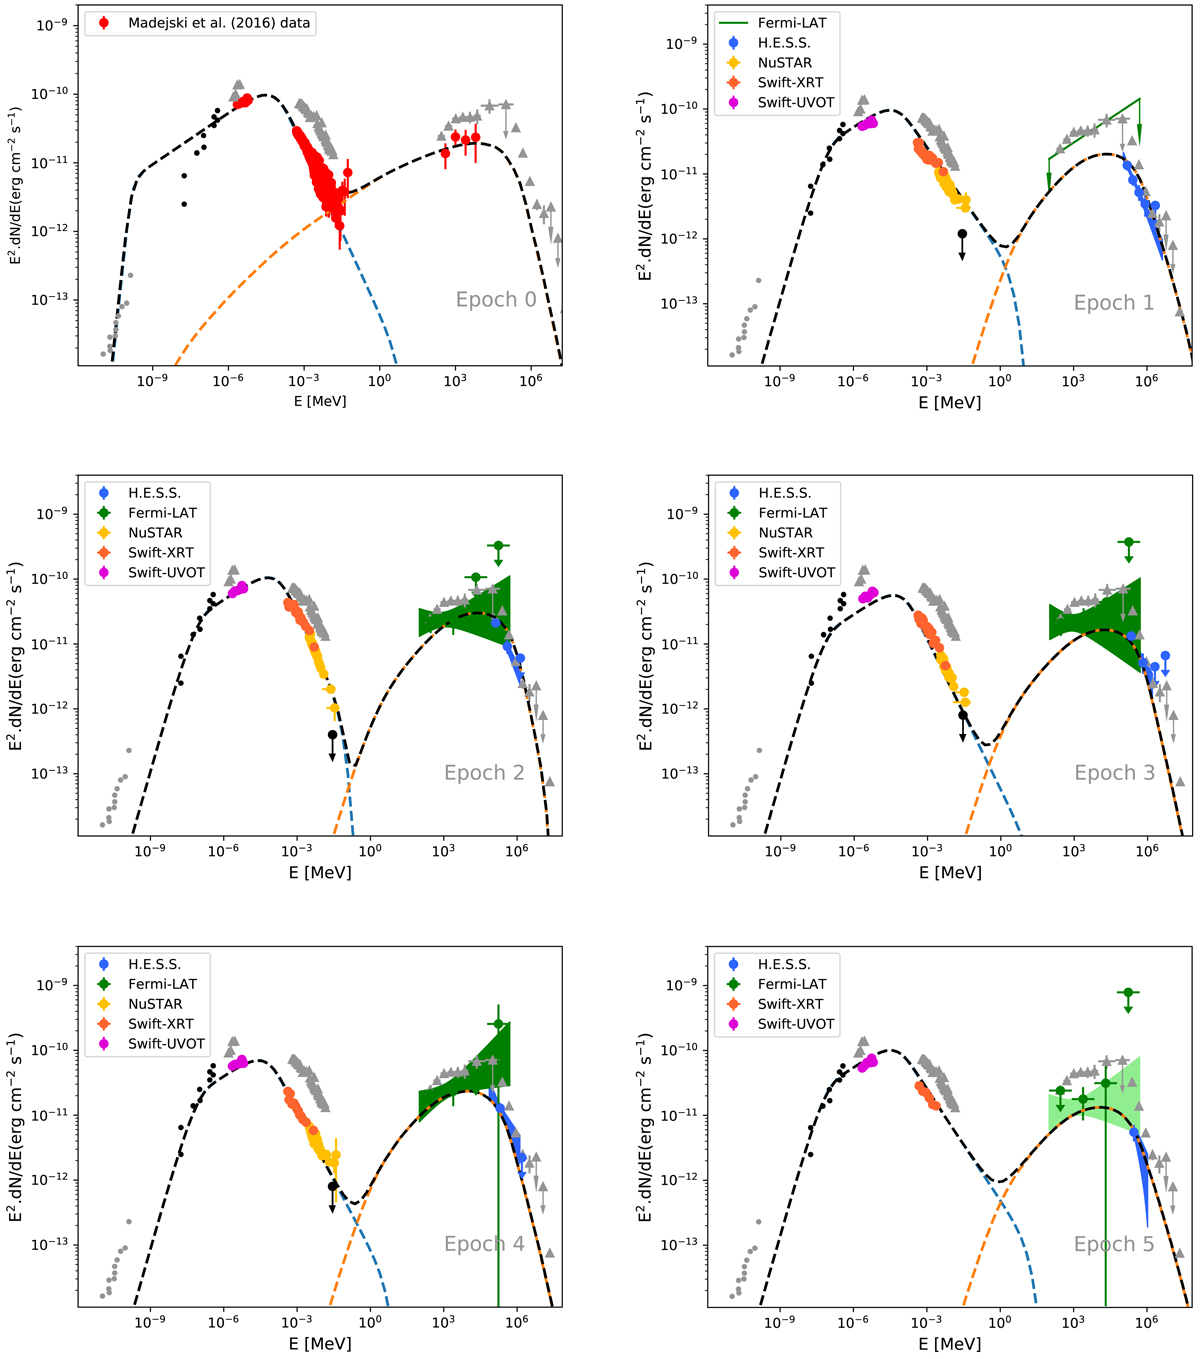
Spectral energy distribution of PKS 2155−304 for each epoch considered in this work. For epoch 0, the red points are directly extracted from Madejski et al. (2016). In the other plots, the purple points are UVOT data, orange are XRT data, and yellow are the NuSTAR data. In γ-rays, the green points and contours are the Fermi-LAT results and H.E.S.S. results are in blue. The black upper limits refer to the hard-tail component (see text) and are used to constrain the inverse-Compton part of the SSC model (black line). The grey points are the data from the 2008 observation campaign (Aharonian et al. 2009) shown for comparison. Black points are the radio data from Abdo et al. (2010) and Liuzzo et al. (2013). The dashed blue line is the synchrotron emission and the orange line is the IC emission. Both are from the SSC calculation, and the black dashed line is the sum of both.
Current usage metrics show cumulative count of Article Views (full-text article views including HTML views, PDF and ePub downloads, according to the available data) and Abstracts Views on Vision4Press platform.
Data correspond to usage on the plateform after 2015. The current usage metrics is available 48-96 hours after online publication and is updated daily on week days.
Initial download of the metrics may take a while.