Fig. 2.
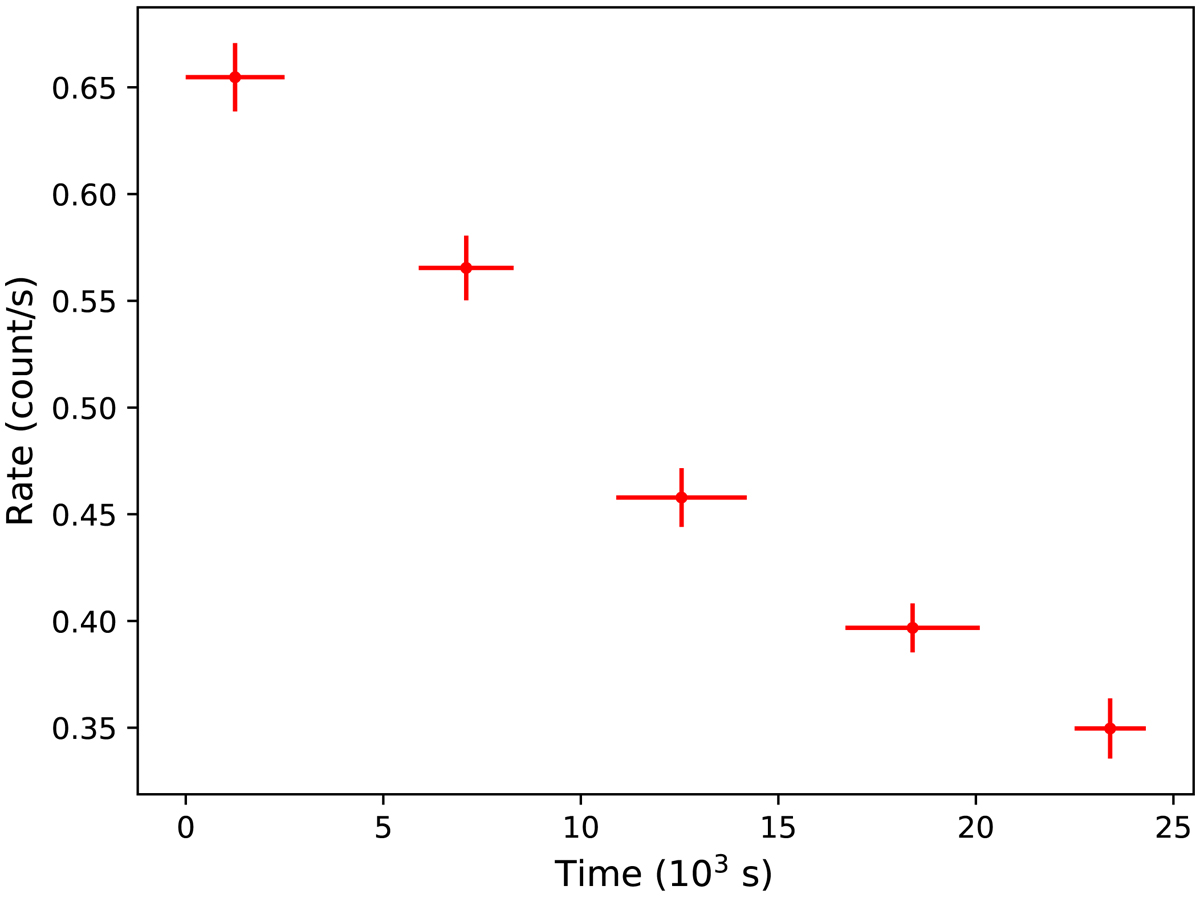
Light curve of PKS 2155−304 as seen by the FPMA module of NuSTAR during the observation 60002022012 (epoch 8). The energy range is 3–60 keV and the plotted data are not background subtracted. However, the background rate is always lower than 0.03 counts per second and the background was steady (within 5%) throughout the observation. Each point corresponds to data taken over roughly one orbit, during the time indicated by the red markers.
Current usage metrics show cumulative count of Article Views (full-text article views including HTML views, PDF and ePub downloads, according to the available data) and Abstracts Views on Vision4Press platform.
Data correspond to usage on the plateform after 2015. The current usage metrics is available 48-96 hours after online publication and is updated daily on week days.
Initial download of the metrics may take a while.