Fig. 5
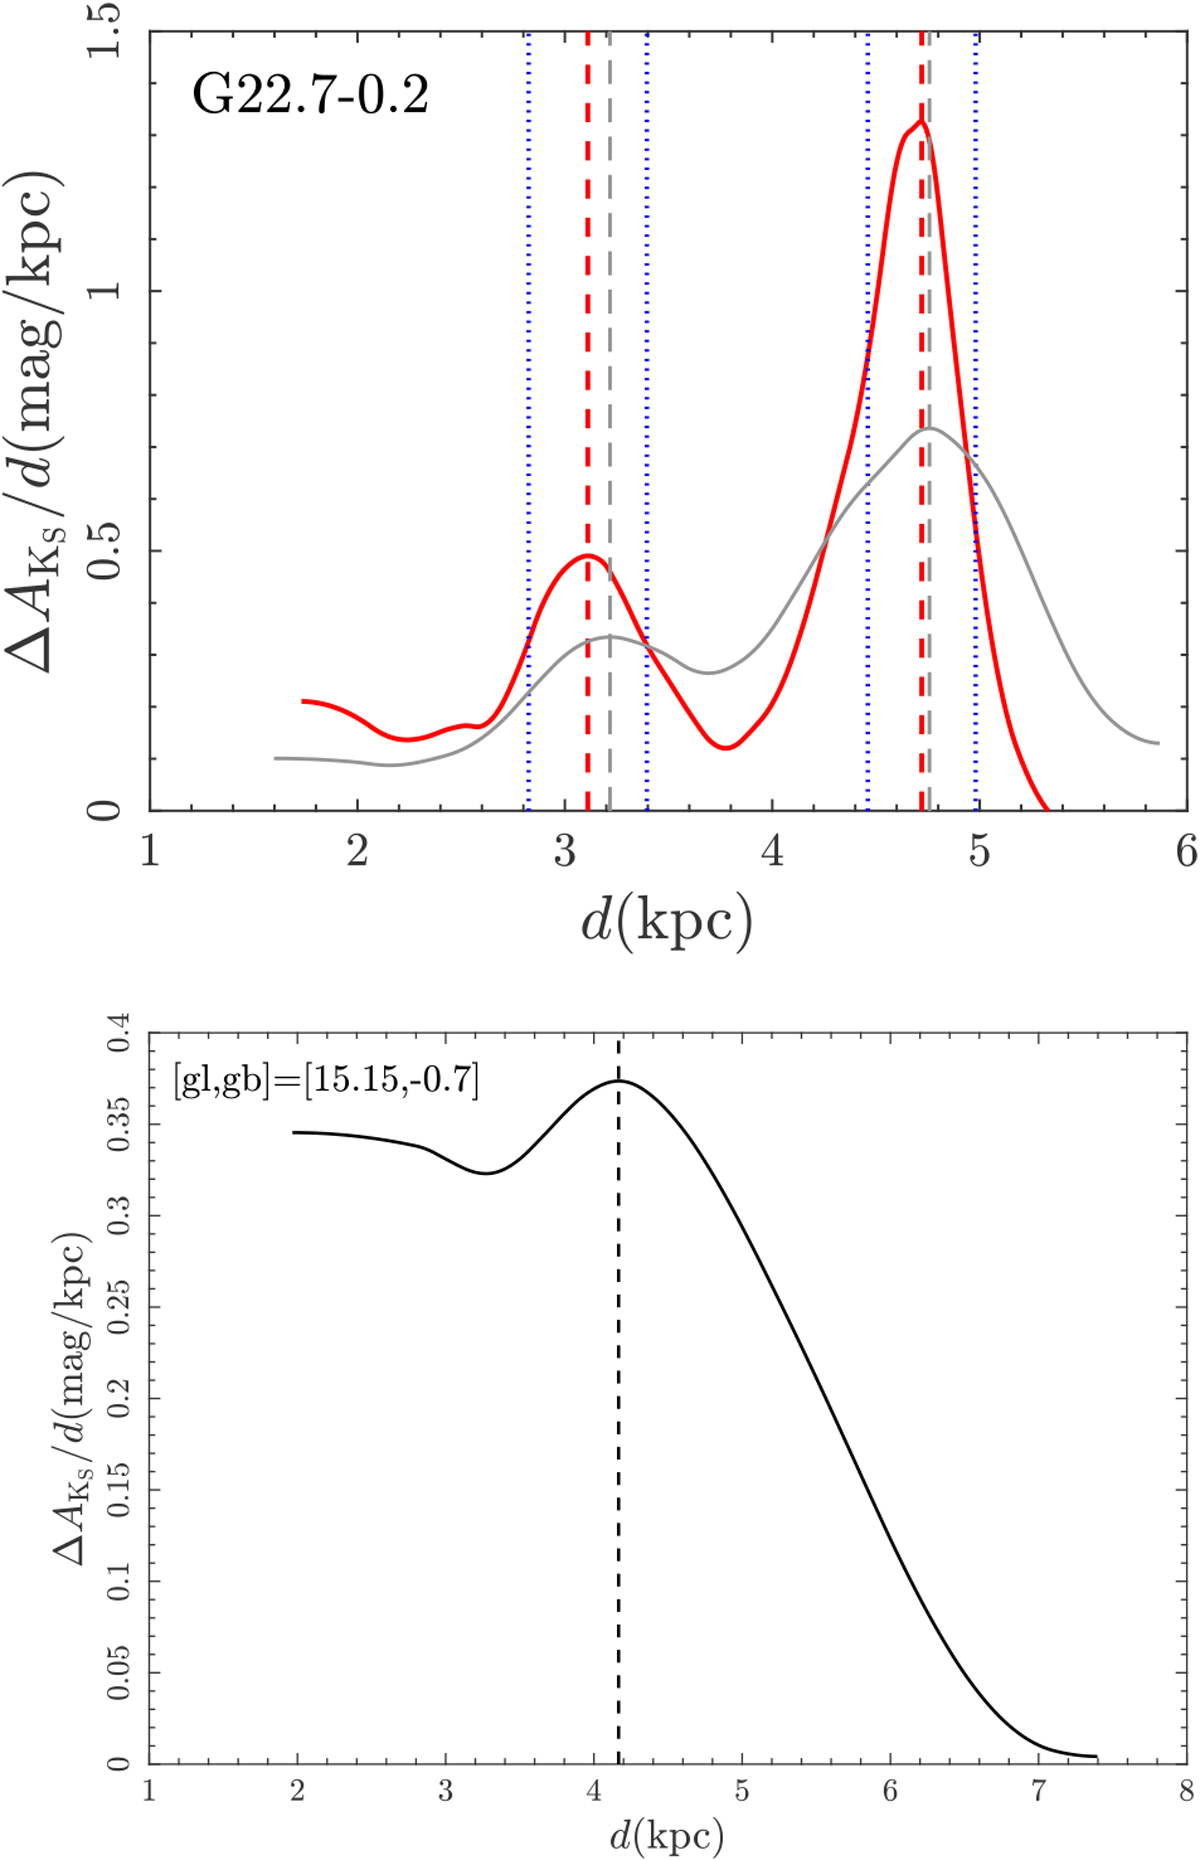
Top: change of differential extinction per distance ![]() with distance for SNR G22.7-0.2 (red line) and the surrounding area (grey lines). For the SNR sightline, there are two significant gradients marked as red dashed lines: the larger one at 4.74 kpc with
with distance for SNR G22.7-0.2 (red line) and the surrounding area (grey lines). For the SNR sightline, there are two significant gradients marked as red dashed lines: the larger one at 4.74 kpc with ![]() mag kpc−1, and the smaller one at 3.11 kpc with
mag kpc−1, and the smaller one at 3.11 kpc with ![]() mag kpc−1. The blue dotted lines indicate the locations of half maximum half width of the profile, which represent the distance errors. For the surrounding area, the extinction gradients are weaker and marked as the grey dashed lines. Bottom: distribution of differential extinction per distance for the sightline of molecular cloud G15.15-0.7.
mag kpc−1. The blue dotted lines indicate the locations of half maximum half width of the profile, which represent the distance errors. For the surrounding area, the extinction gradients are weaker and marked as the grey dashed lines. Bottom: distribution of differential extinction per distance for the sightline of molecular cloud G15.15-0.7.
Current usage metrics show cumulative count of Article Views (full-text article views including HTML views, PDF and ePub downloads, according to the available data) and Abstracts Views on Vision4Press platform.
Data correspond to usage on the plateform after 2015. The current usage metrics is available 48-96 hours after online publication and is updated daily on week days.
Initial download of the metrics may take a while.