Free Access
Fig. 3
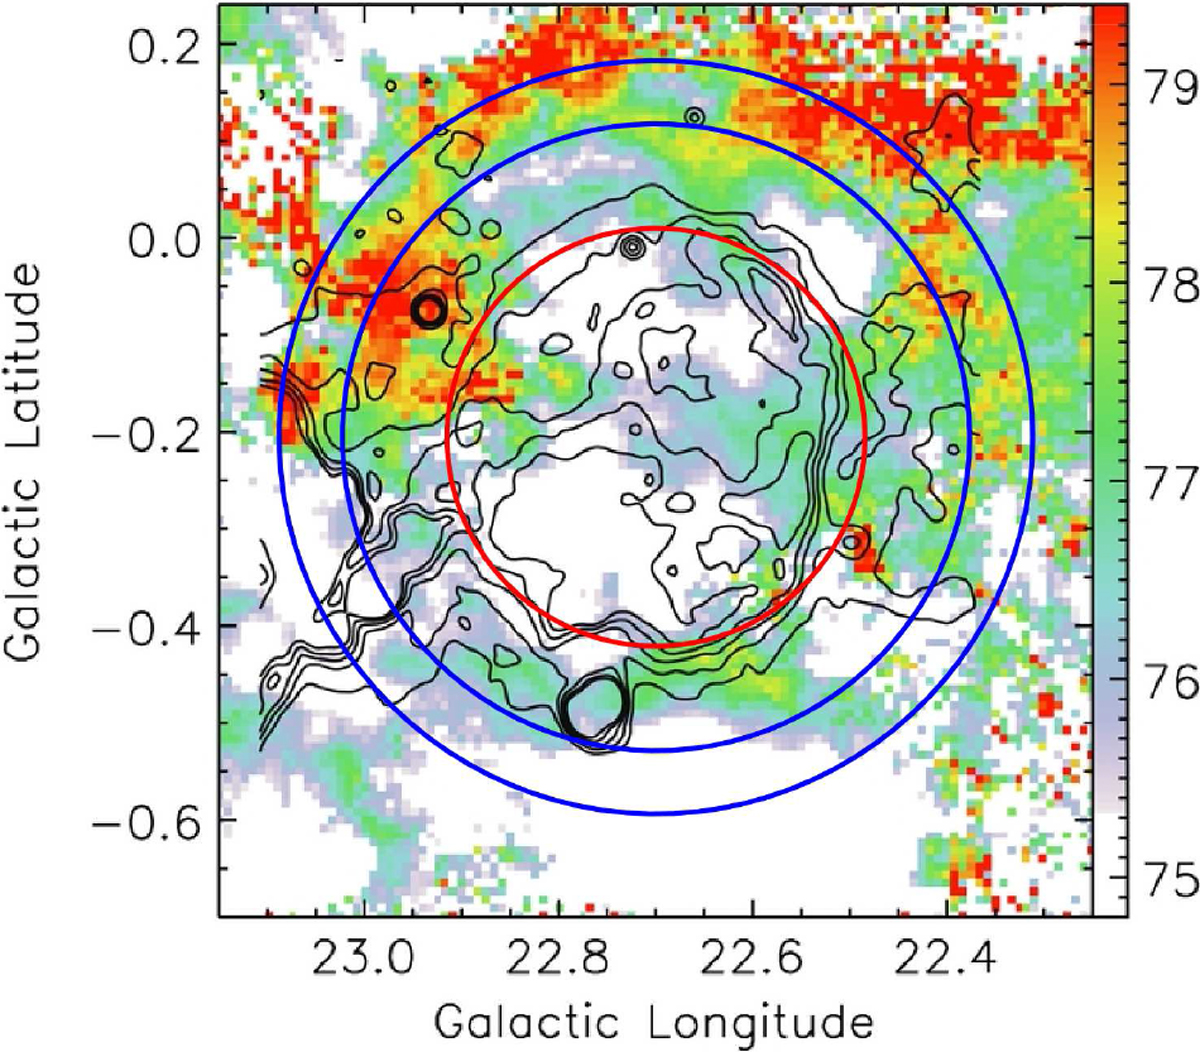
Definition of the SNR area (the red circle) and the surrounding area (the blue annulus) for SNR G22.7-0.2 as an example. The background image is the 13CO (J = 1–0) emission map overlaid with the 1.4 GHz radio continuum emission contours from Su et al. (2014).
Current usage metrics show cumulative count of Article Views (full-text article views including HTML views, PDF and ePub downloads, according to the available data) and Abstracts Views on Vision4Press platform.
Data correspond to usage on the plateform after 2015. The current usage metrics is available 48-96 hours after online publication and is updated daily on week days.
Initial download of the metrics may take a while.