Free Access
Fig. A.1
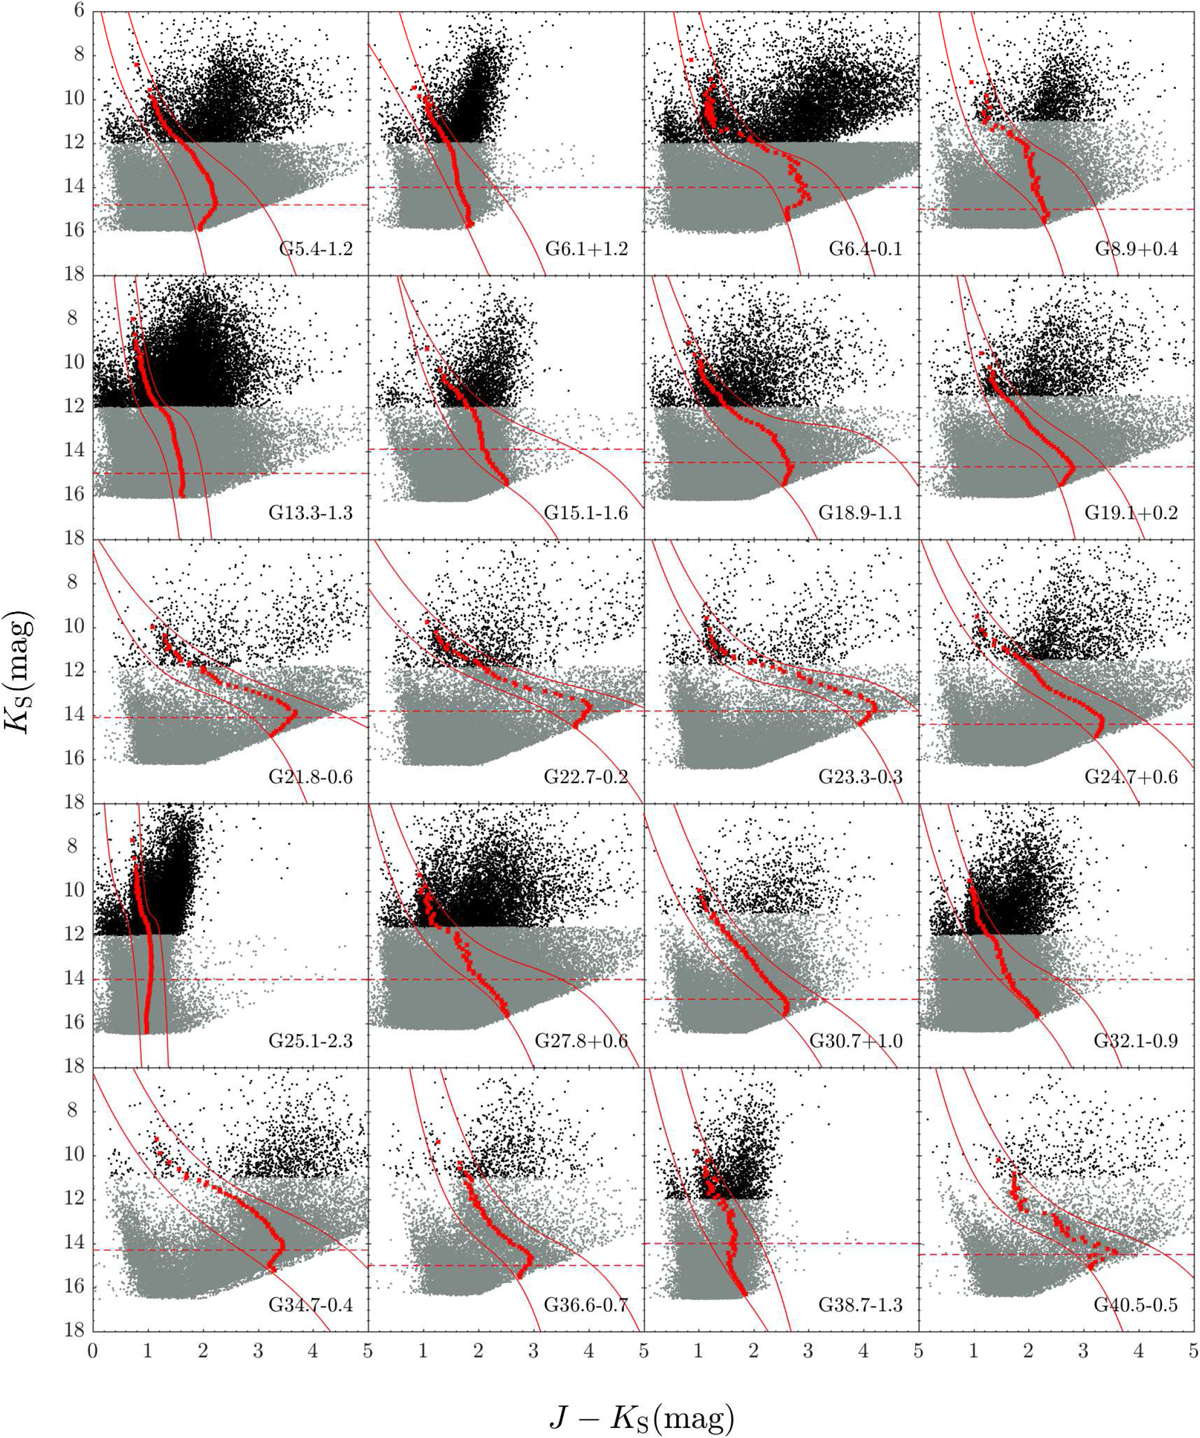
CMDs for SNRs in UKIDSS. Black points denote the 2MASS data, grey points denote the UKIDSS data, red cubic curves roughly outline the range of RCs, red points are the RC ridge, and red dashed line represents the cutoff magnitude.
Current usage metrics show cumulative count of Article Views (full-text article views including HTML views, PDF and ePub downloads, according to the available data) and Abstracts Views on Vision4Press platform.
Data correspond to usage on the plateform after 2015. The current usage metrics is available 48-96 hours after online publication and is updated daily on week days.
Initial download of the metrics may take a while.