Fig. 1
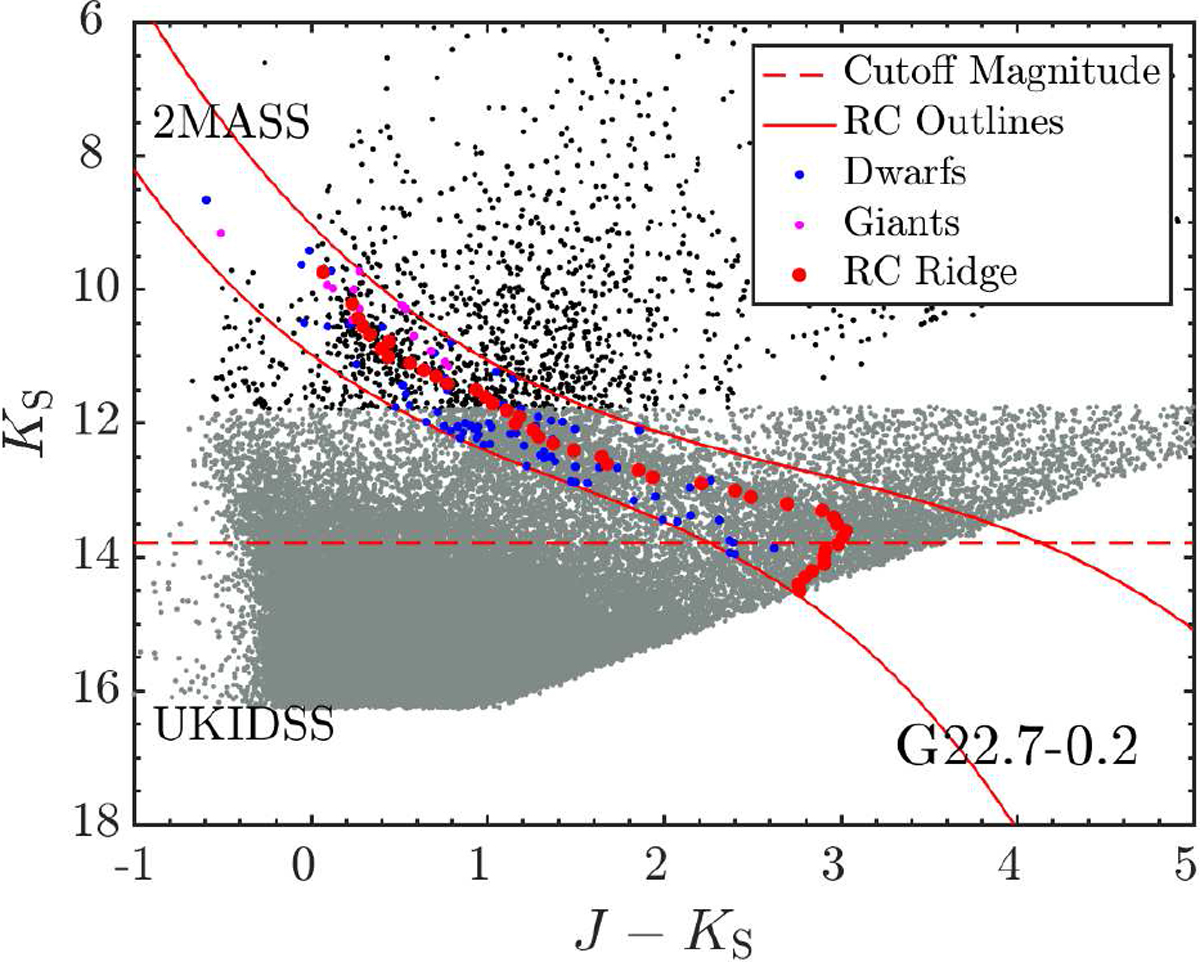
CMD of the SNR G22.7-0.2. Black points denote the 2MASS data, and grey points denote the UKIDSS data. The borderline is at KS = 11.8 mag. Blue points mark dwarfs, and magenta points mark giants which are picked through a comparison with the Gaia parallaxes (Sect. 3.2). Red cubic curves roughly outline the range of RCs. The points located between two red curves are thought to be RCs. The RC ridge is described by red points which is derived by the normal parameter estimation in this case. Red dashed line represents the cutoff magnitude which is 13.8 mag here.
Current usage metrics show cumulative count of Article Views (full-text article views including HTML views, PDF and ePub downloads, according to the available data) and Abstracts Views on Vision4Press platform.
Data correspond to usage on the plateform after 2015. The current usage metrics is available 48-96 hours after online publication and is updated daily on week days.
Initial download of the metrics may take a while.