Free Access
Fig. 1.
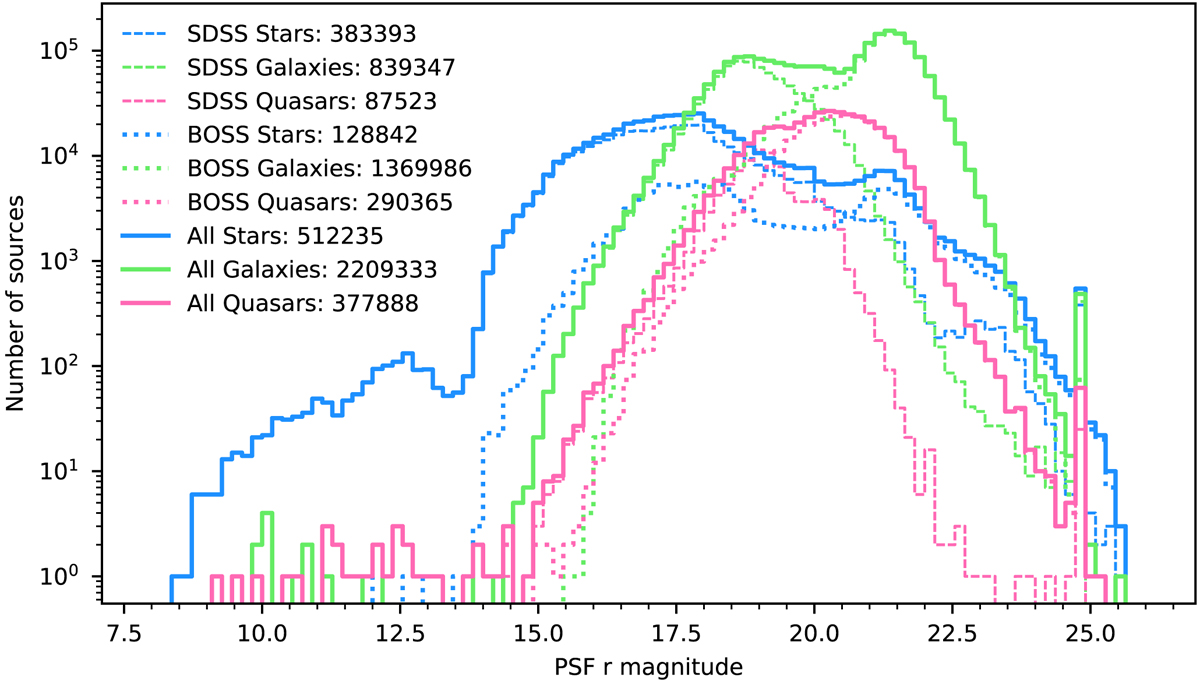
Histogram of 3.1 million spectroscopically observed galaxies, quasars, and stars from both the SDSS and BOSS instruments (after removing unclean data). There is a double peaked distribution for galaxies and quasars due to each instrument having different target magnitude selection criteria.
Current usage metrics show cumulative count of Article Views (full-text article views including HTML views, PDF and ePub downloads, according to the available data) and Abstracts Views on Vision4Press platform.
Data correspond to usage on the plateform after 2015. The current usage metrics is available 48-96 hours after online publication and is updated daily on week days.
Initial download of the metrics may take a while.