Fig. 9.
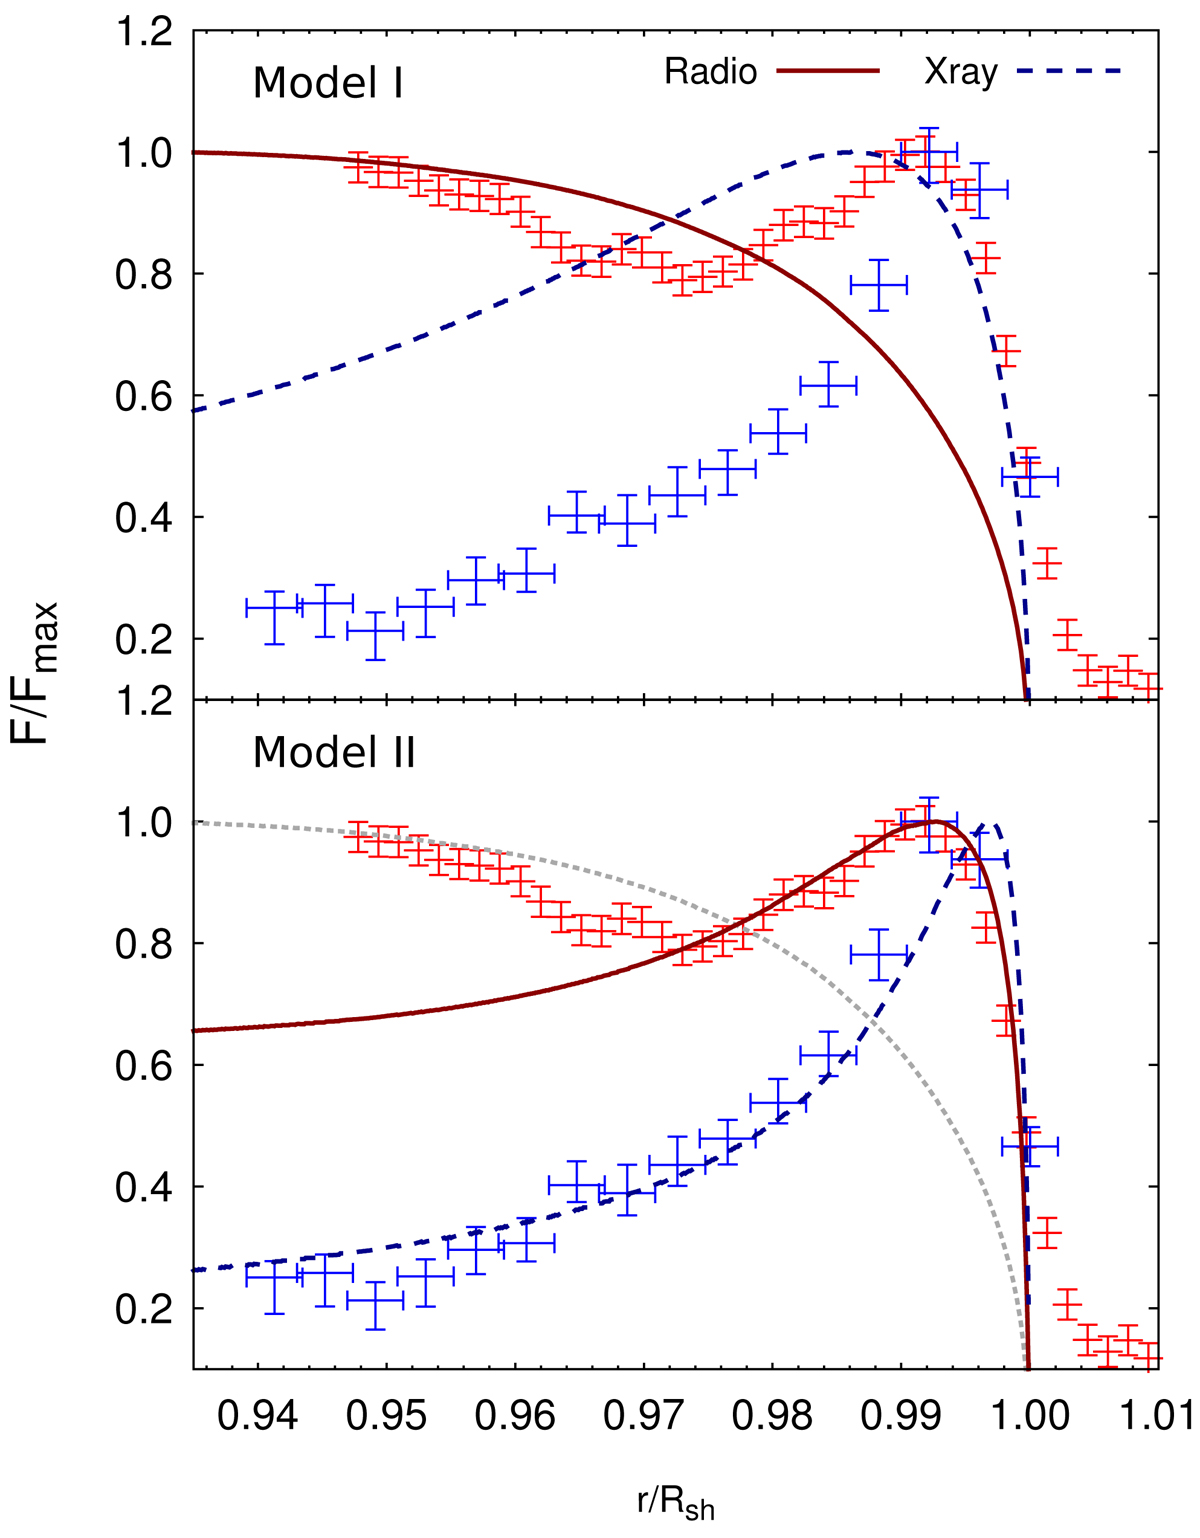
Radial intensity profiles for Model I (top panel) and Model II (bottom panel). X-ray emission at 1 keV (blue dashed line) was observed with Chandra (Cassam-Chenaï et al. 2007), and radio data at 1.4 GHz (red solid line) were taken from Slane et al. (2014). Following Slane et al. (2014) the radio data were slightly shifted to account for the expansion of the remnant. The gray dotted line in the bottom panel represents a radio profile produced without magnetic-field damping.
Current usage metrics show cumulative count of Article Views (full-text article views including HTML views, PDF and ePub downloads, according to the available data) and Abstracts Views on Vision4Press platform.
Data correspond to usage on the plateform after 2015. The current usage metrics is available 48-96 hours after online publication and is updated daily on week days.
Initial download of the metrics may take a while.