Free Access
Fig. 2.
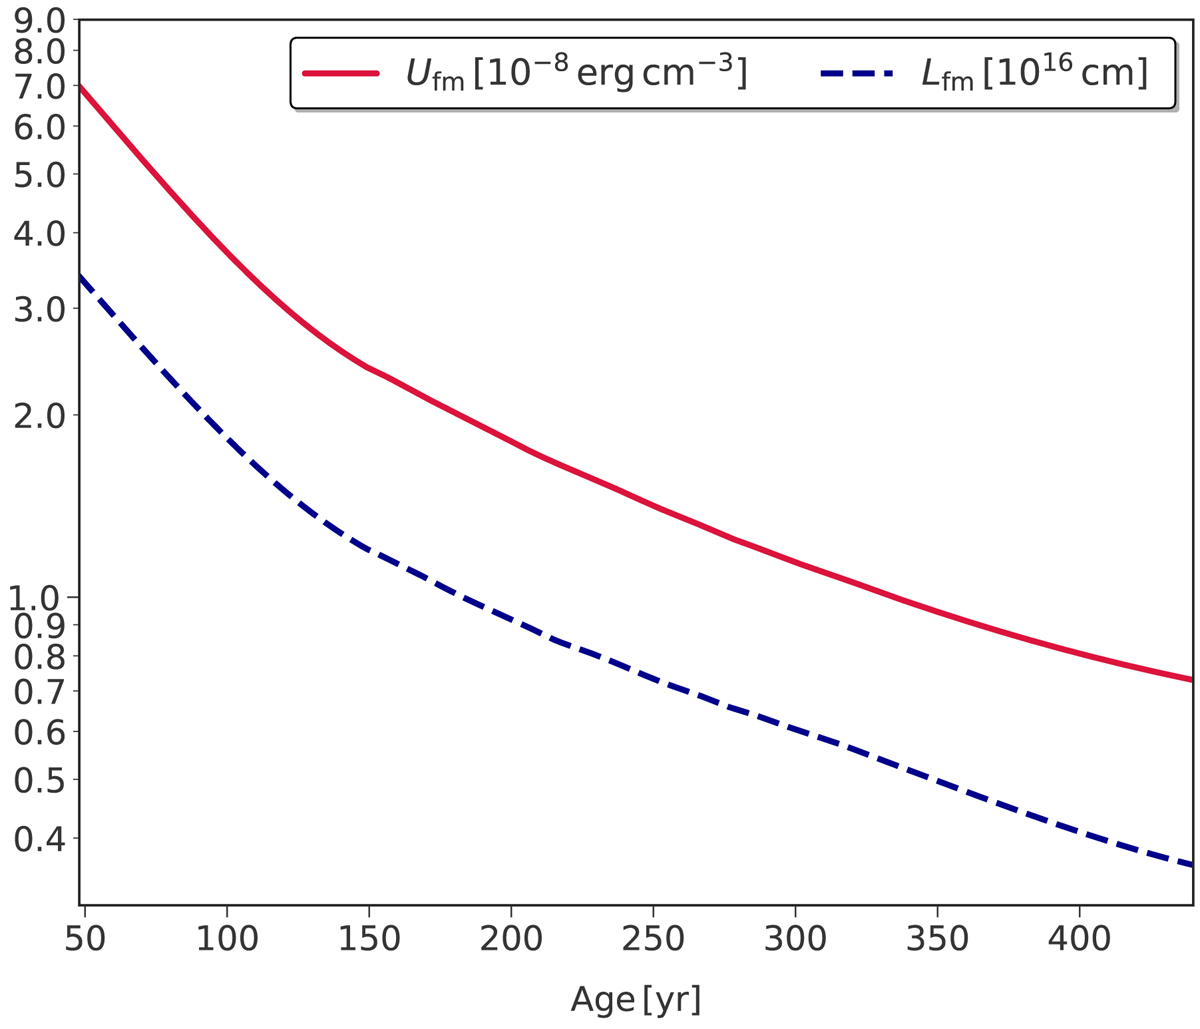
Energy density in fast-mode waves (red solid line) and width of the turbulent re-acceleration region (blue dashed line), both as a function of time for Model I.
Current usage metrics show cumulative count of Article Views (full-text article views including HTML views, PDF and ePub downloads, according to the available data) and Abstracts Views on Vision4Press platform.
Data correspond to usage on the plateform after 2015. The current usage metrics is available 48-96 hours after online publication and is updated daily on week days.
Initial download of the metrics may take a while.