Fig. 7.
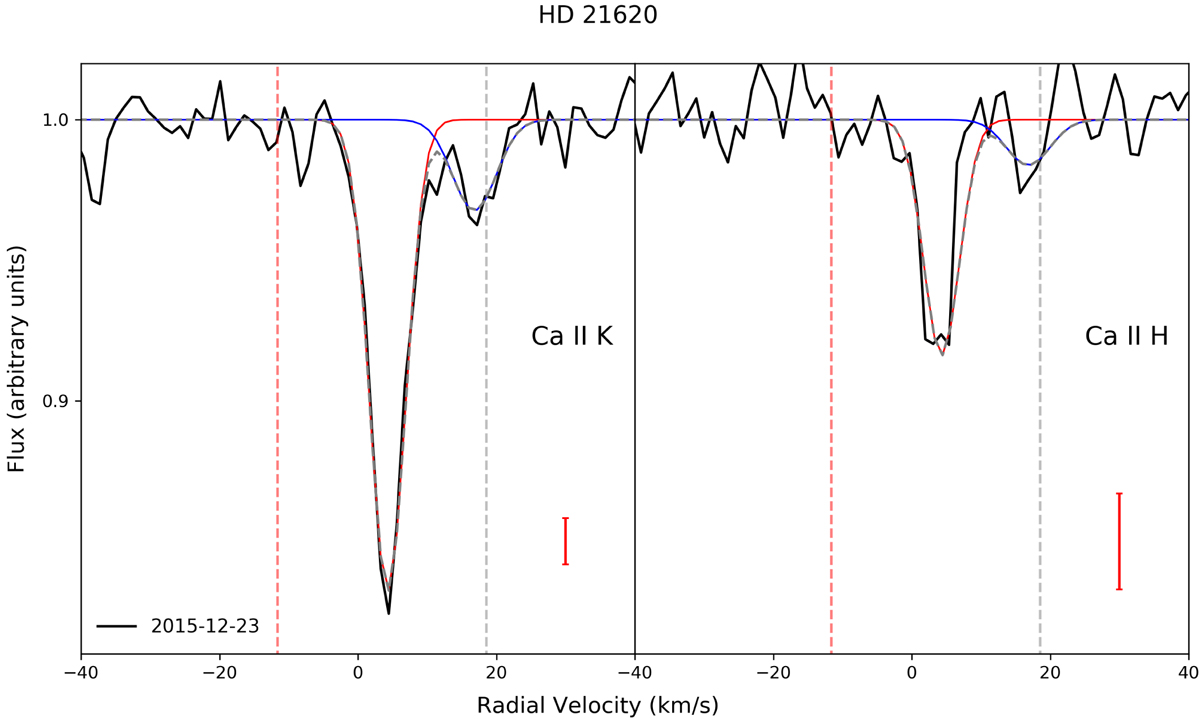
Ca II K and H lines as observed on December 23, 2015 using HERMES. Two Gaussians are fitted to the K non-photospheric feature with velocities of 4.3 km s−1 (red continuous line) and 16.8 km s−1 (blue continuous line). The strongest, stable 4.3 km s−1 absorption is clearly detected in the H line, but the weakest, variable absorption at 16.8 km s−1 is embedded in the noise of the H spectrum. Vertical red- and grey-dashed lines show the stellar and ISM radial velocities, respectively.
Current usage metrics show cumulative count of Article Views (full-text article views including HTML views, PDF and ePub downloads, according to the available data) and Abstracts Views on Vision4Press platform.
Data correspond to usage on the plateform after 2015. The current usage metrics is available 48-96 hours after online publication and is updated daily on week days.
Initial download of the metrics may take a while.