Fig. 5.
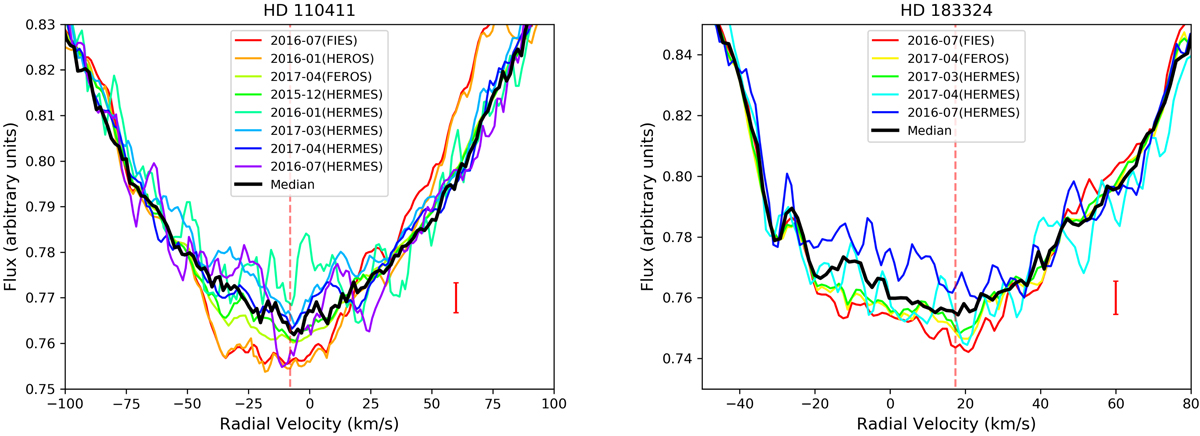
Photospheric profile of Ca II K spectra of HD 110411 and HD 183324. The dates and instruments are colour-coded as indicated in the legend. The core of the line varies, although neither a narrow feature nor transient events are clearly distinguishable. The red-dashed vertical line marks the radial velocity of the star. The red error bar shows the 3-σ standard deviation in the region close to the bottom of the line. This applies to all upcoming figures.
Current usage metrics show cumulative count of Article Views (full-text article views including HTML views, PDF and ePub downloads, according to the available data) and Abstracts Views on Vision4Press platform.
Data correspond to usage on the plateform after 2015. The current usage metrics is available 48-96 hours after online publication and is updated daily on week days.
Initial download of the metrics may take a while.