Free Access
Fig. 4.
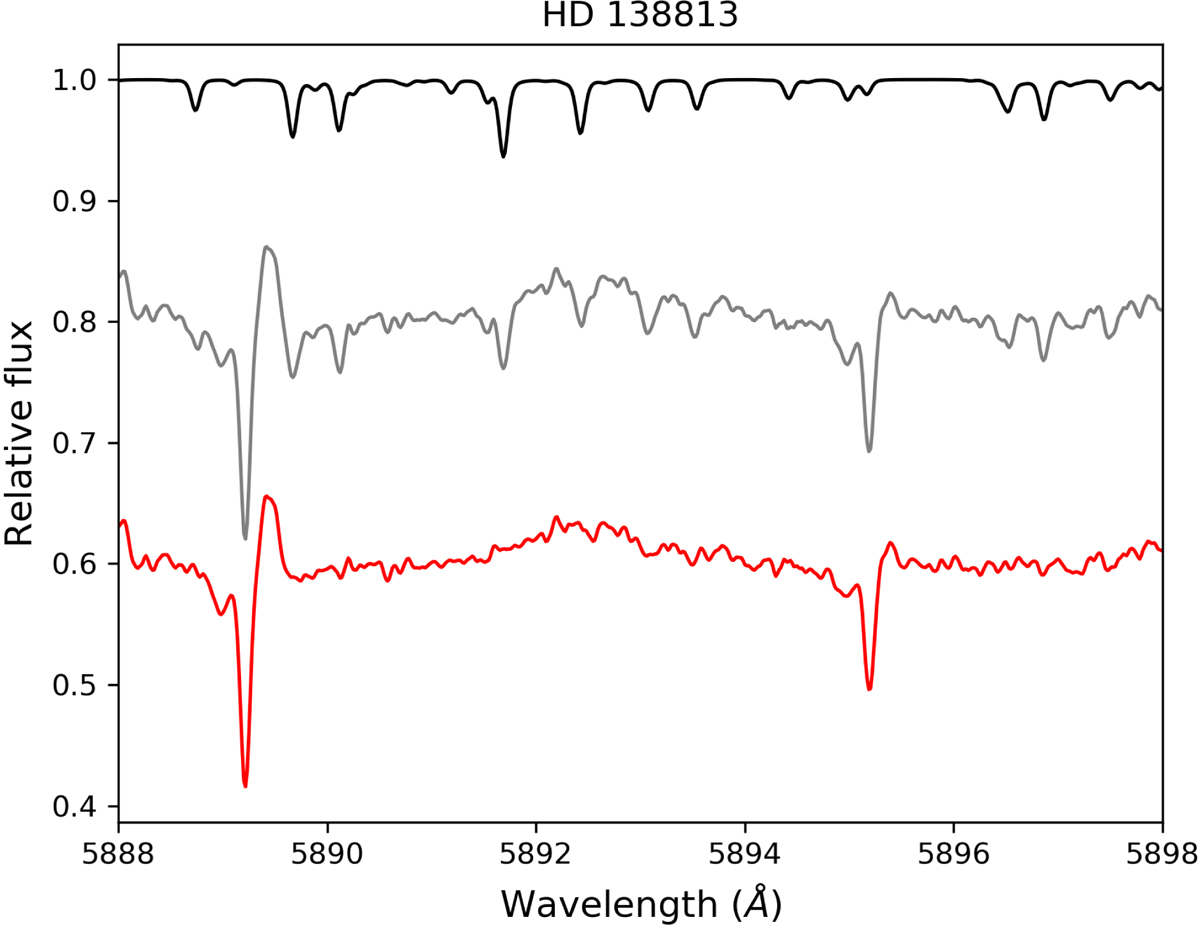
Na I D lines of HD 138813, where the emission near the radial velocity of the star is easily recognisable and clearly present in the uncorrected spectra (grey line) and does not originate as an over subtraction of the atmospheric model (black line). The red line shows the telluric corrected spectrum.
Current usage metrics show cumulative count of Article Views (full-text article views including HTML views, PDF and ePub downloads, according to the available data) and Abstracts Views on Vision4Press platform.
Data correspond to usage on the plateform after 2015. The current usage metrics is available 48-96 hours after online publication and is updated daily on week days.
Initial download of the metrics may take a while.