Fig. A.1.
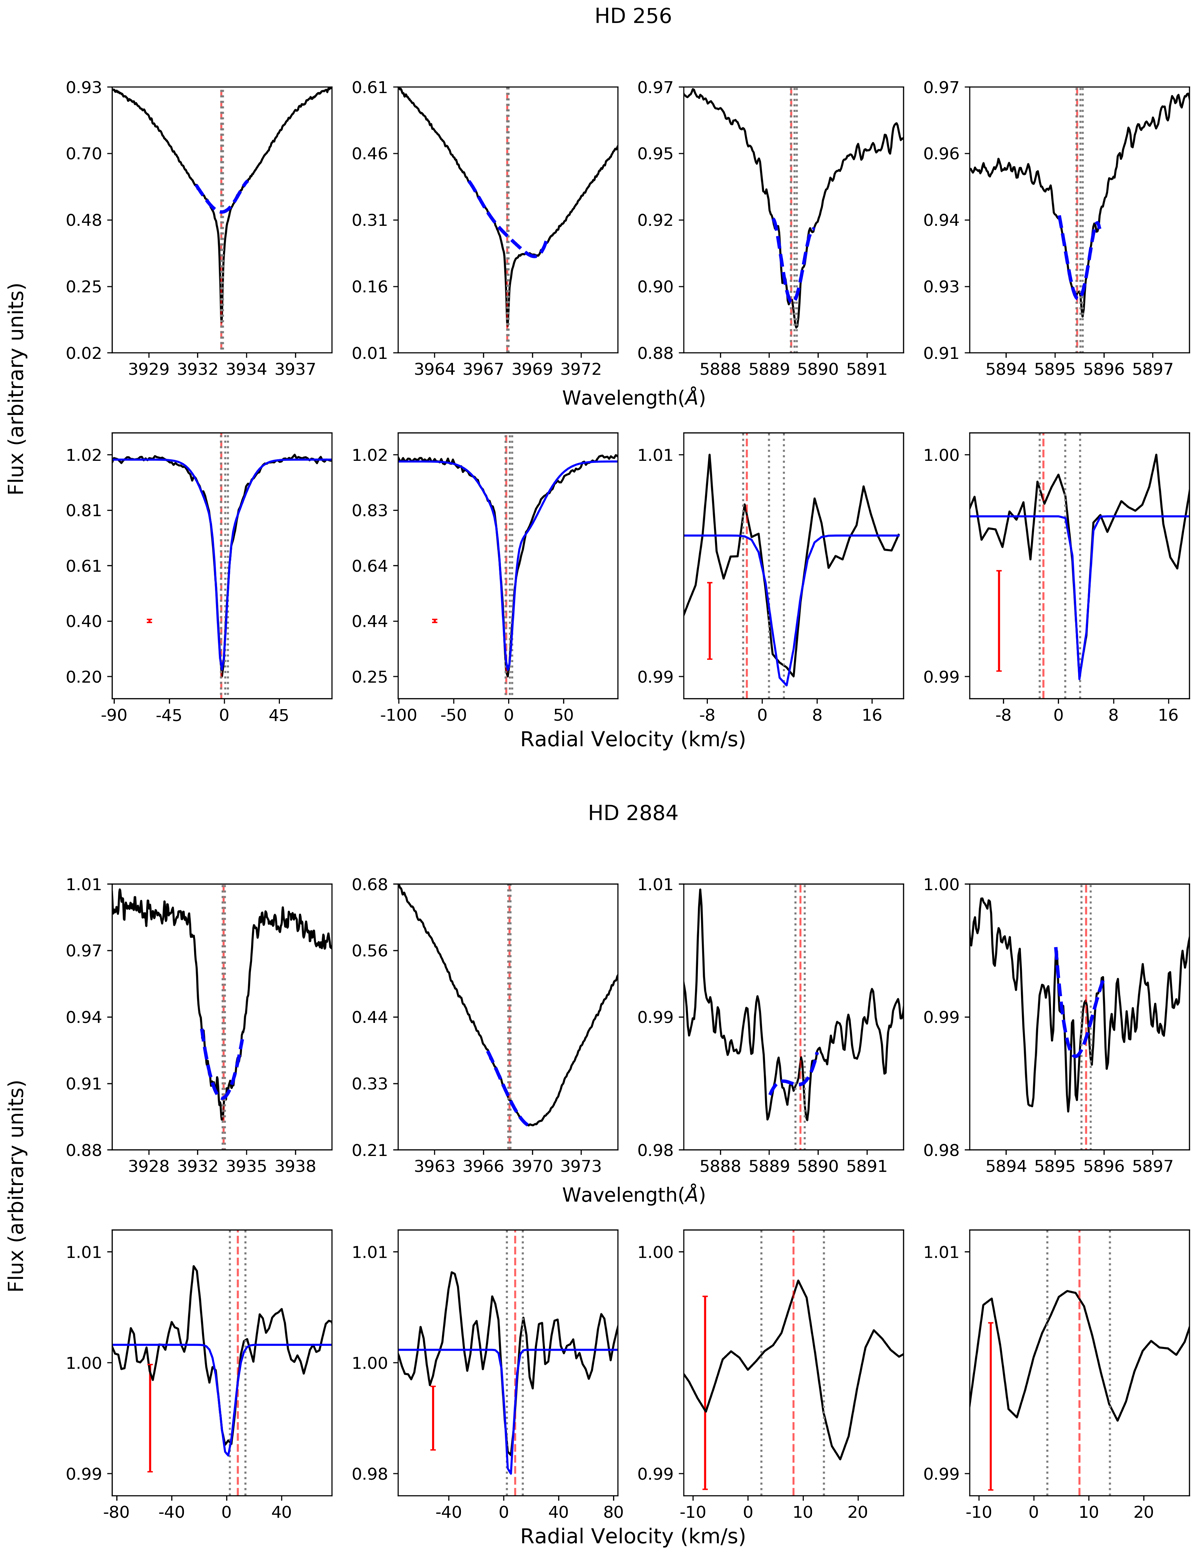
Stars showing narrow non-photospheric absorptions. Top panels: photospheric Ca II H & K and Na I D lines with fitted modelling, the blue-dashed line, x-axis shows the wavelength. Bottom panels: residuals once the spectrum was divided by the photosphere, x-axis in velocity. Blue lines mark the fits to the non-photospheric absorptions. Vertical red-dashed and grey dotted-lines represent the stellar radial velocity and the ISM velocities, respectively. The red error bars show three sigma values measured in the continuum adjacent to the photospheric line.
Current usage metrics show cumulative count of Article Views (full-text article views including HTML views, PDF and ePub downloads, according to the available data) and Abstracts Views on Vision4Press platform.
Data correspond to usage on the plateform after 2015. The current usage metrics is available 48-96 hours after online publication and is updated daily on week days.
Initial download of the metrics may take a while.