Fig. 30.
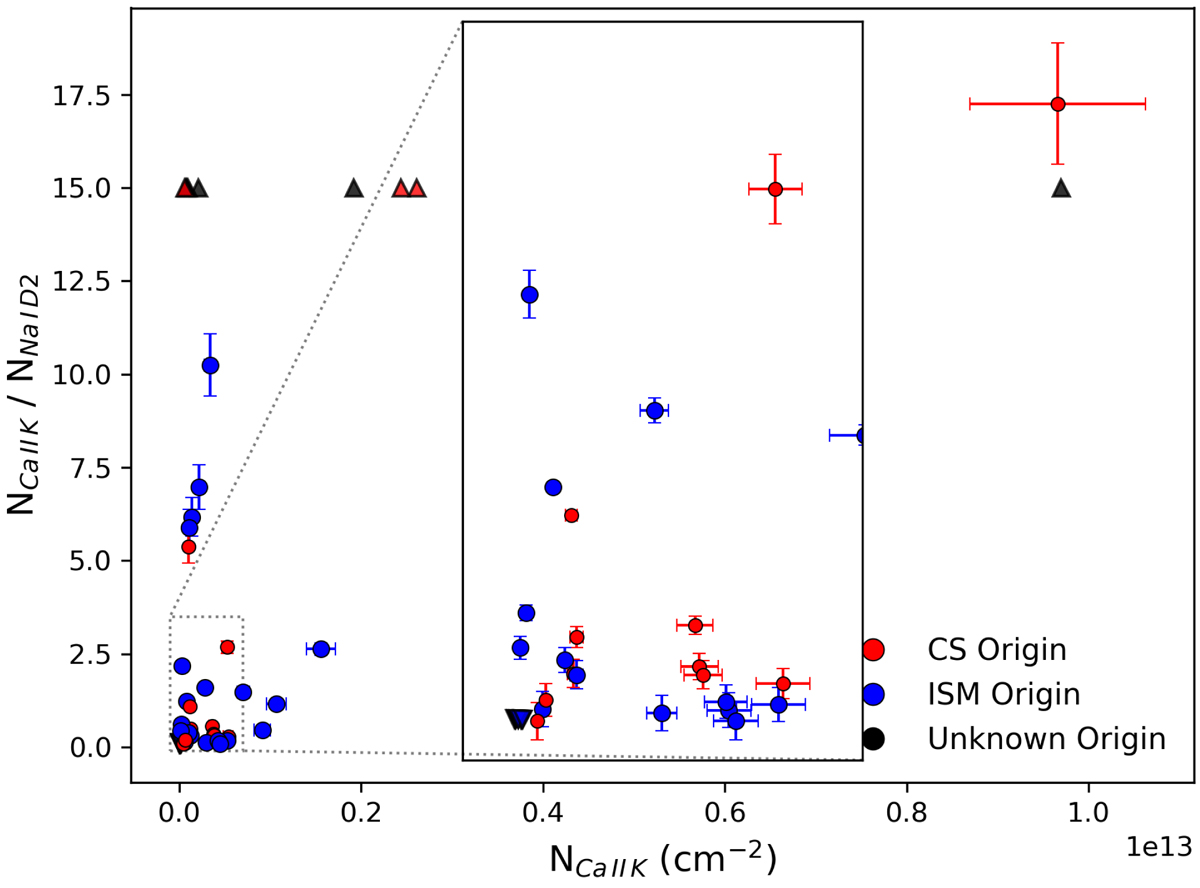
Column densities of Ca II K and ratio of column density of Ca II K and Na I D2 of those absorptions of similar radial velocities. For the case where an absorption was detected in only one of the lines, triangles pointing up are upper limits and triangles pointing down are lower limits. The outlier in the upper-left corner of the plot is HD 42111. Colour denotes the suggested origin as in the legend.
Current usage metrics show cumulative count of Article Views (full-text article views including HTML views, PDF and ePub downloads, according to the available data) and Abstracts Views on Vision4Press platform.
Data correspond to usage on the plateform after 2015. The current usage metrics is available 48-96 hours after online publication and is updated daily on week days.
Initial download of the metrics may take a while.