Fig. 23.
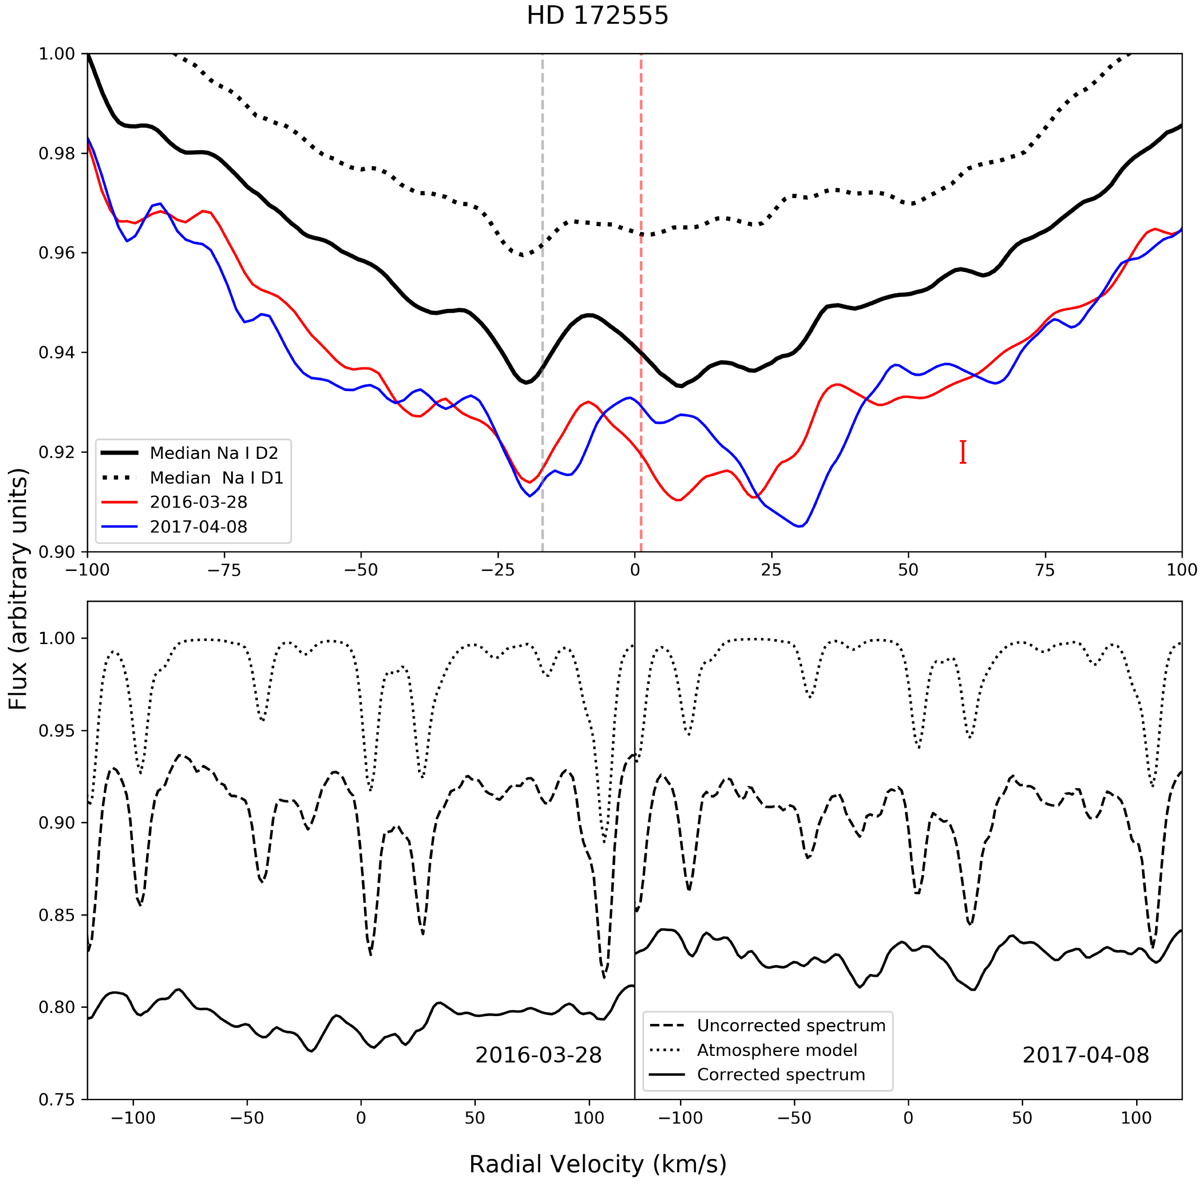
Top panel: absorptions detected in the Na I D2 line of HD 172555. The black lines correspond to the median of all spectra for Na I D2 (solid line) and D1 (dotted line). The blue and red lines correspond to two different dates, where the variations in the ∼15 km s−1 Na I D2 component can be perceived. Bottom panel: examples of the telluric subtraction are plotted in order to show that this process is not the source of the variability. In both cases, spectra were obtained using FEROS. The red and grey vertical lines mark the stellar and ISM radial velocities, respectively.
Current usage metrics show cumulative count of Article Views (full-text article views including HTML views, PDF and ePub downloads, according to the available data) and Abstracts Views on Vision4Press platform.
Data correspond to usage on the plateform after 2015. The current usage metrics is available 48-96 hours after online publication and is updated daily on week days.
Initial download of the metrics may take a while.