Free Access
Fig. 2.
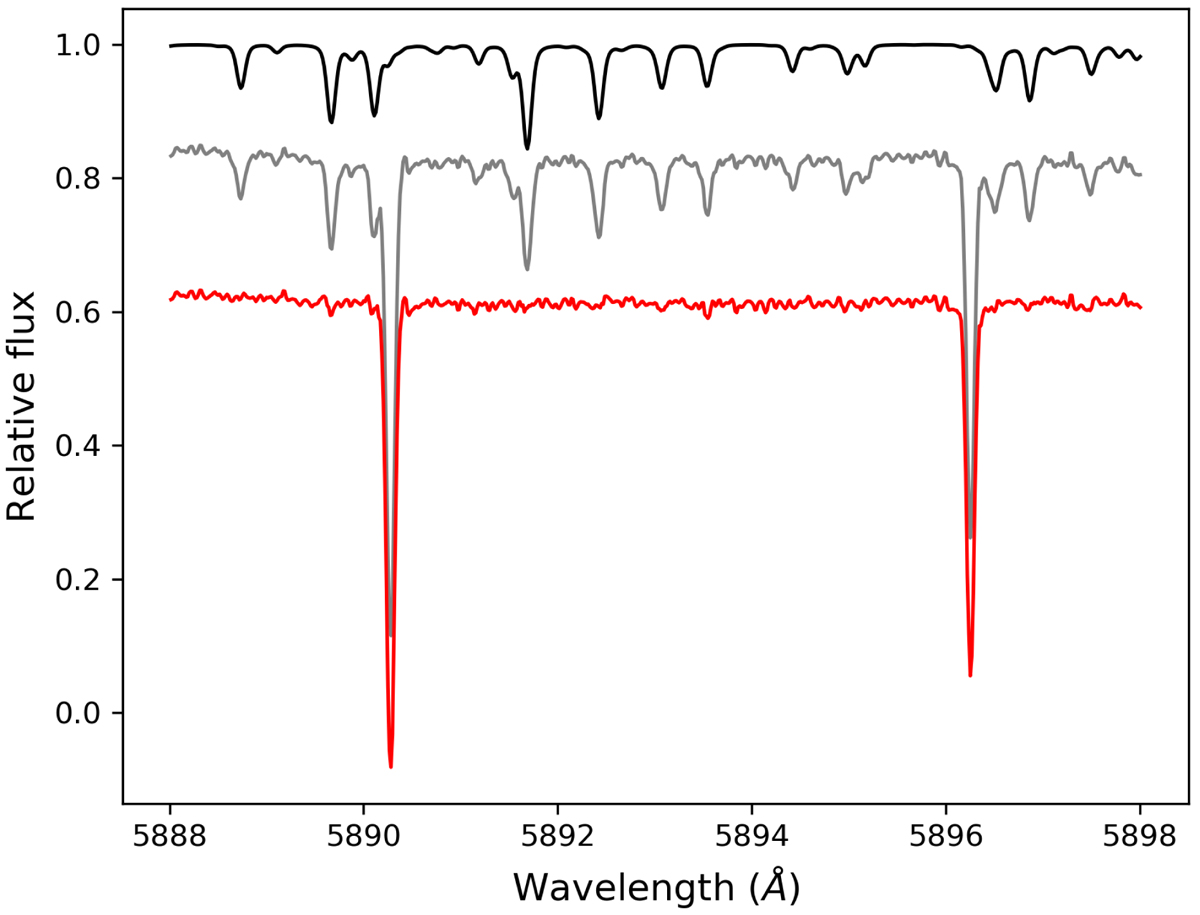
Example of telluric subtraction in HD 21620 in the Na I D spectral region. The black line shows the MOLECFIT atmospheric model, the grey line shows the observed spectrum, and the red line shows the final telluric-free HD 21620 spectrum.
Current usage metrics show cumulative count of Article Views (full-text article views including HTML views, PDF and ePub downloads, according to the available data) and Abstracts Views on Vision4Press platform.
Data correspond to usage on the plateform after 2015. The current usage metrics is available 48-96 hours after online publication and is updated daily on week days.
Initial download of the metrics may take a while.