Fig. 19.
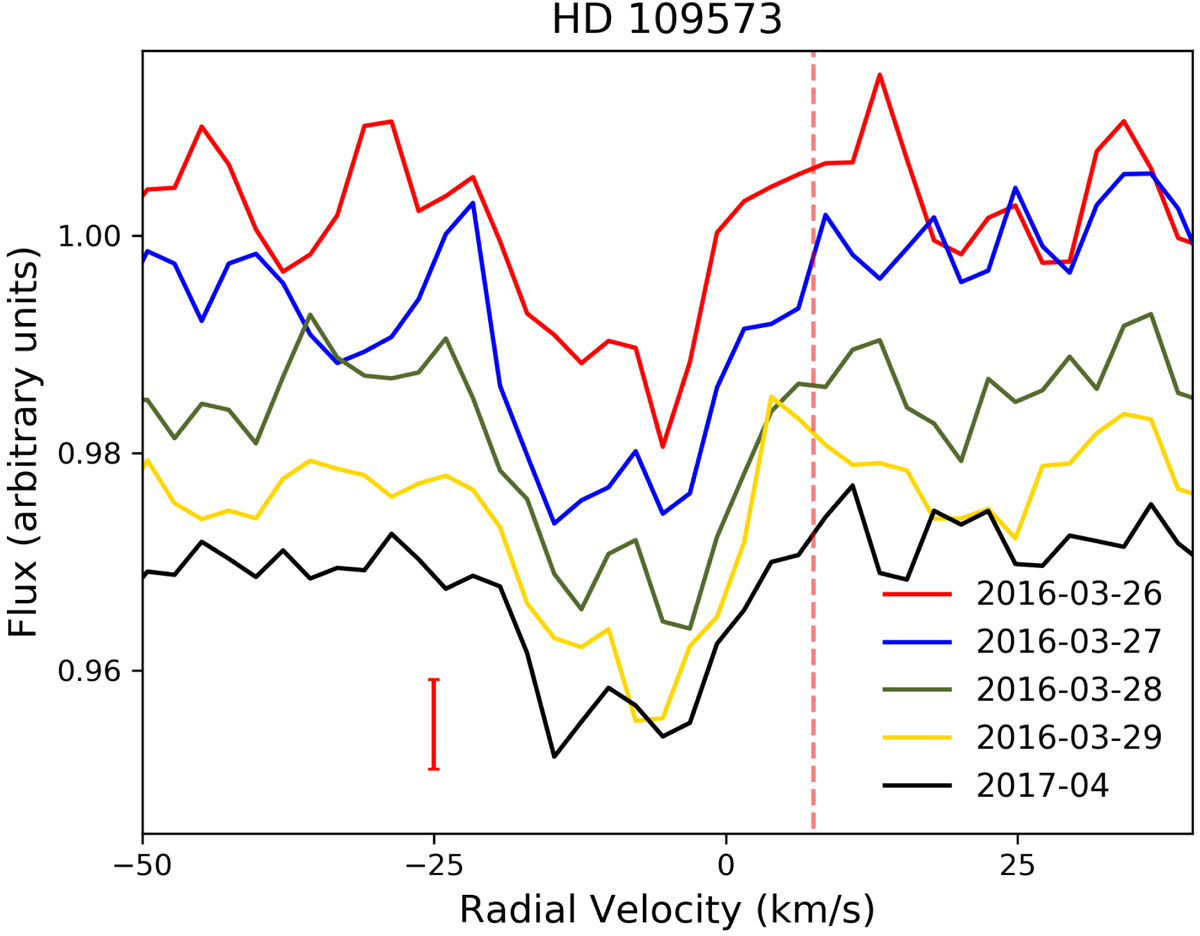
Ca II K line of HD 109573. A shift of 0.005 was added to the Y-axis in order to help differentiate the variations. All spectra were obtained using FEROS. The red vertical line corresponds to the radial velocity of the star. The Ca II K line shows two absorptions, which are not coincident with the radial velocity of the star but with variations in their strength.
Current usage metrics show cumulative count of Article Views (full-text article views including HTML views, PDF and ePub downloads, according to the available data) and Abstracts Views on Vision4Press platform.
Data correspond to usage on the plateform after 2015. The current usage metrics is available 48-96 hours after online publication and is updated daily on week days.
Initial download of the metrics may take a while.