Fig. 17.
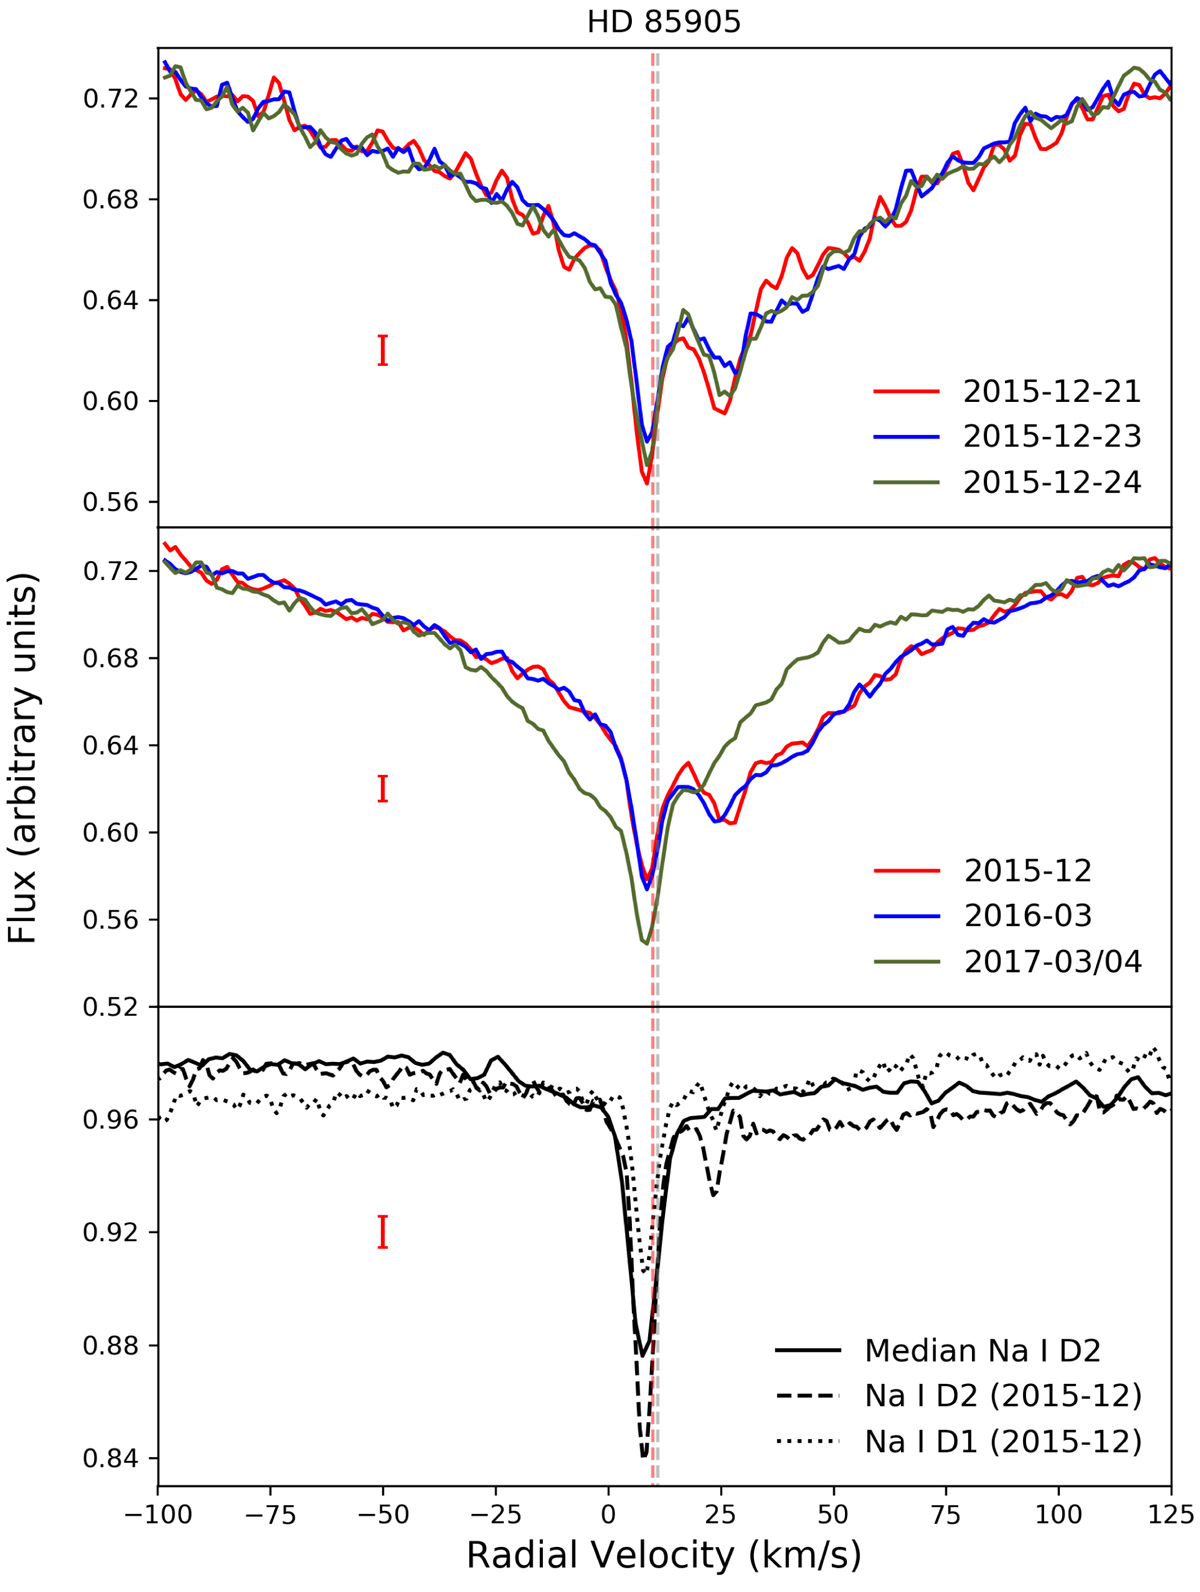
Top panel: December 21, 23, and 24, 2015 where variability of the ∼25 km s−1 Ca II K feature can be seen. Middle panel: Ca II K median spectra of three different campaigns using HERMES where the variability in the triangular profile is seen. The absorption at ∼25 km s−1 disappears in March 2017. Lower panel: Na I D lines of December 2015 where the absorption at ∼23 km s−1 is visible. The median of all spectra in the Na I D2 line where the absorption is no longer present is also shown. The vertical lines correspond to the radial velocities of the star and of the ISM.
Current usage metrics show cumulative count of Article Views (full-text article views including HTML views, PDF and ePub downloads, according to the available data) and Abstracts Views on Vision4Press platform.
Data correspond to usage on the plateform after 2015. The current usage metrics is available 48-96 hours after online publication and is updated daily on week days.
Initial download of the metrics may take a while.