Fig. 16.
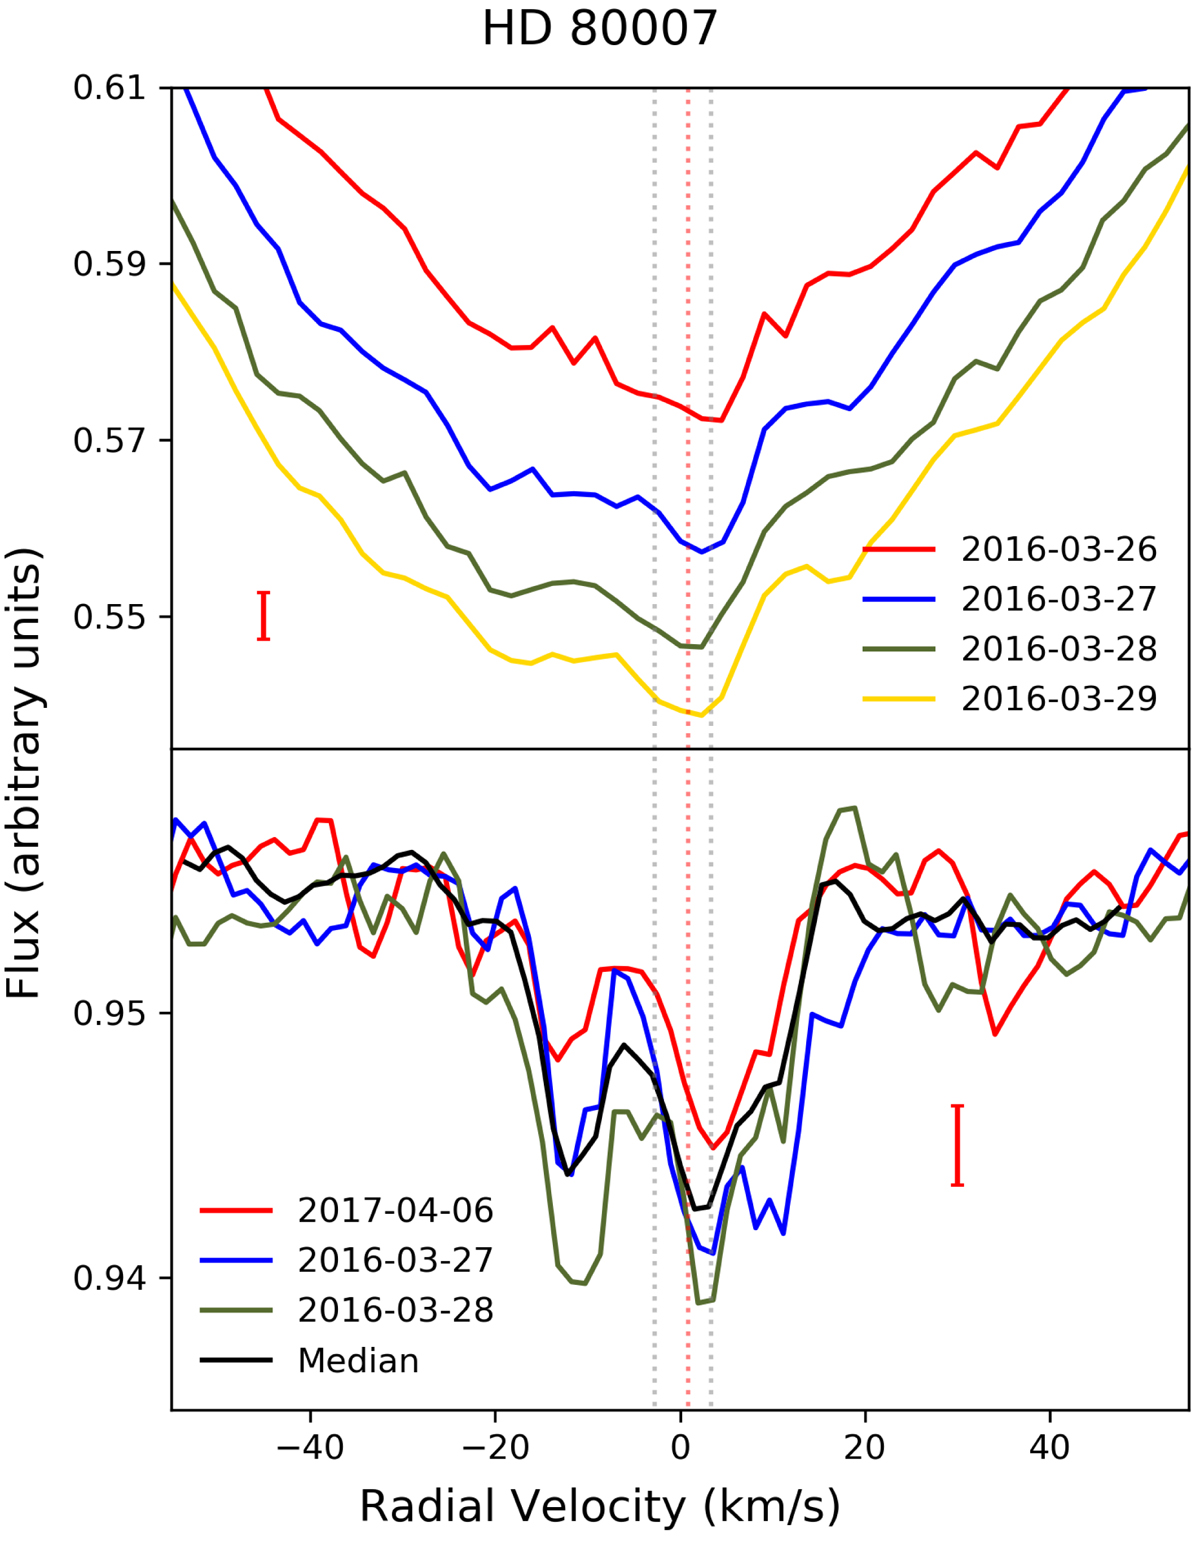
Top panel: Ca II K line of HD 80007 for the selected days, observed with FEROS. Spectra were shifted 0.01 units in the Y-axis aimed at facilitating the visualisation of the variability. The central absorption is seen at ∼2 km s−1 as well as blue- and red-shifted variable absorptions. Bottom panel: Na I D2 line of HD 80007 for the selected days. Variability is seen at ∼–10 and ∼2 km s−1. The slight shift at the bottom of the narrow absorptions, which is presumably produced by a companion, is noticeable in both panels.
Current usage metrics show cumulative count of Article Views (full-text article views including HTML views, PDF and ePub downloads, according to the available data) and Abstracts Views on Vision4Press platform.
Data correspond to usage on the plateform after 2015. The current usage metrics is available 48-96 hours after online publication and is updated daily on week days.
Initial download of the metrics may take a while.