Fig. 12.
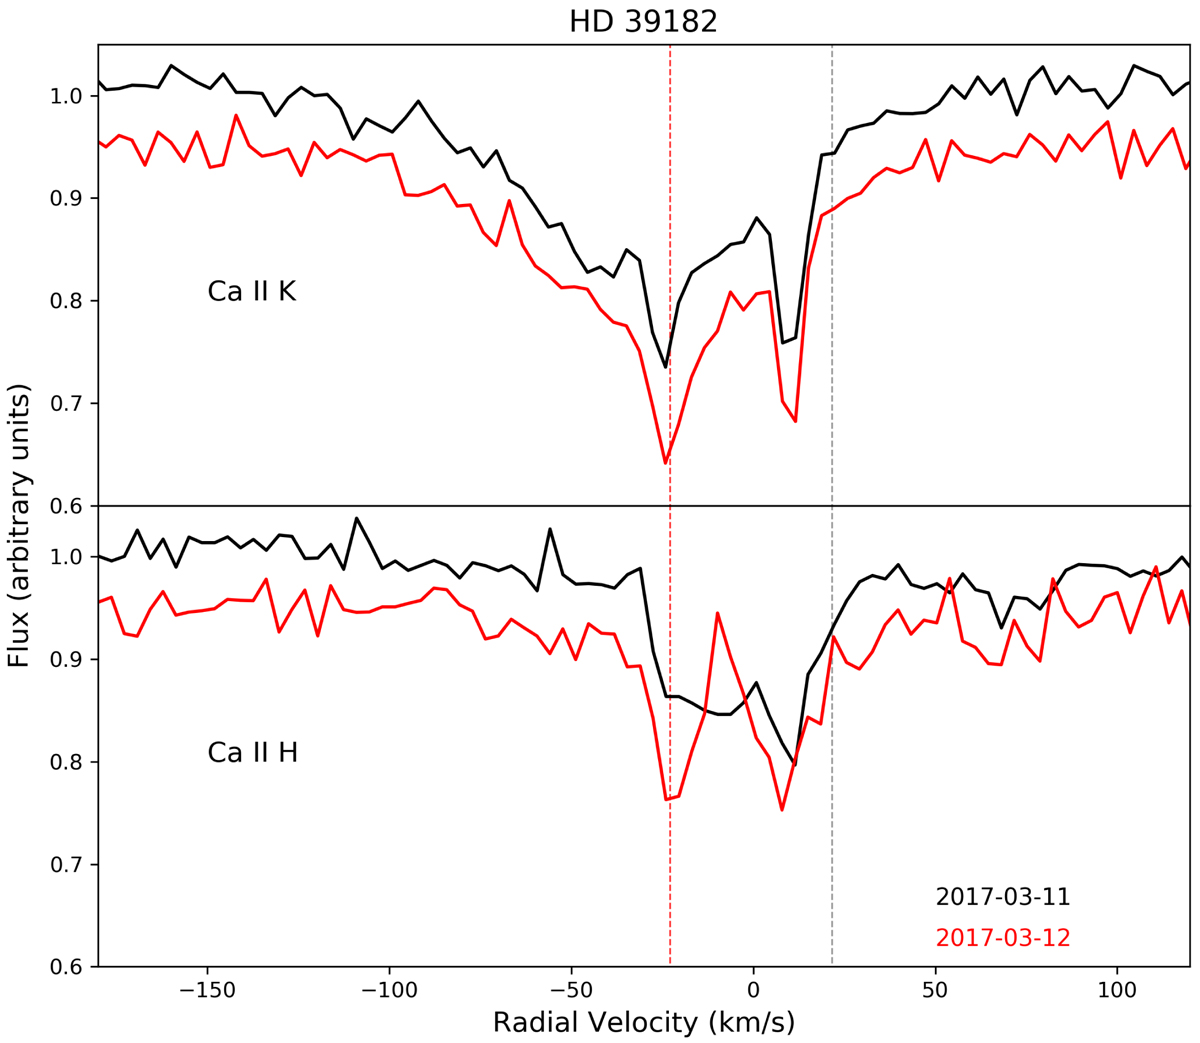
Ca II K and H lines of HD 39182 are colour-coded for two different observing dates obtained with HERMES. Spectra were shifted 0.05 units in the Y-axis with the aim of facilitating the visualisation of the variability. The red and grey vertical lines correspond to the radial velocity of the star and the velocity vector of the LIC Colorado cloud, respectively.
Current usage metrics show cumulative count of Article Views (full-text article views including HTML views, PDF and ePub downloads, according to the available data) and Abstracts Views on Vision4Press platform.
Data correspond to usage on the plateform after 2015. The current usage metrics is available 48-96 hours after online publication and is updated daily on week days.
Initial download of the metrics may take a while.