Fig. 9.
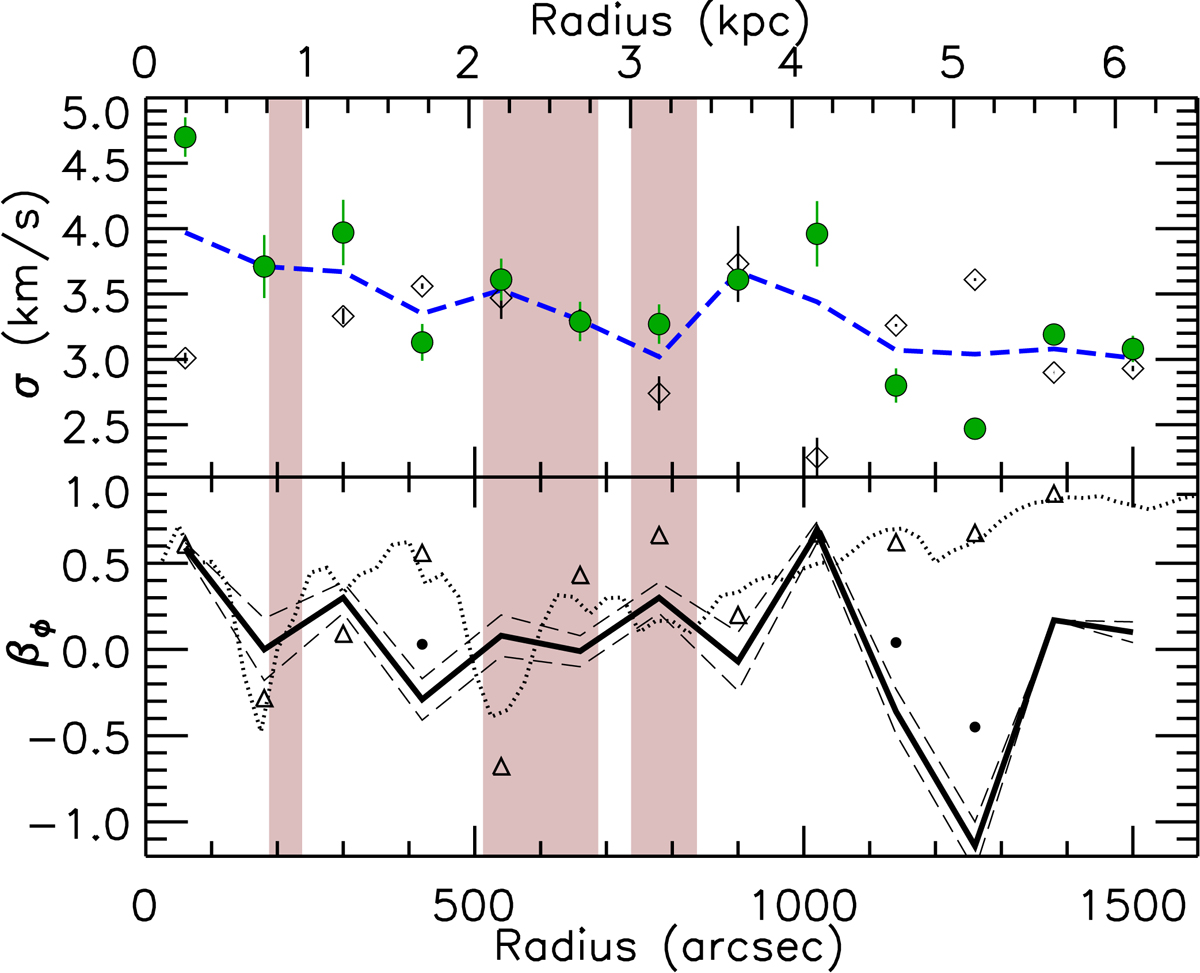
Results for the molecular gas in Messier 33. Top: profiles of σR and σϕ of CO gas, obtained assuming σz = ⟨σlos⟩ϕ (dashed blue line, corrected for instrumental dispersion) and a null thermal component. Filled circles are for σR and open diamonds are for σϕ. Bottom: profiles of azimuthal velocity anisotropy βϕ of CO gas. The solid line shows the anisotropy obtained assuming σz = ⟨σlos⟩ϕ and a null thermal component, and dashed lines show the ±1 rms errors. For comparison, the anisotropy of the atomic gas as derived from all pixels in the 100 pc resolution velocity dispersion map is shown as a dotted line, and that derived using only the pixels at the positions of the molecular clouds as open triangles. Filled circles are values derived by masking a few deviant dispersions of CO clouds (σlos > 5 km s−1). Shaded areas are as in Fig. 4.
Current usage metrics show cumulative count of Article Views (full-text article views including HTML views, PDF and ePub downloads, according to the available data) and Abstracts Views on Vision4Press platform.
Data correspond to usage on the plateform after 2015. The current usage metrics is available 48-96 hours after online publication and is updated daily on week days.
Initial download of the metrics may take a while.