Fig. 7.
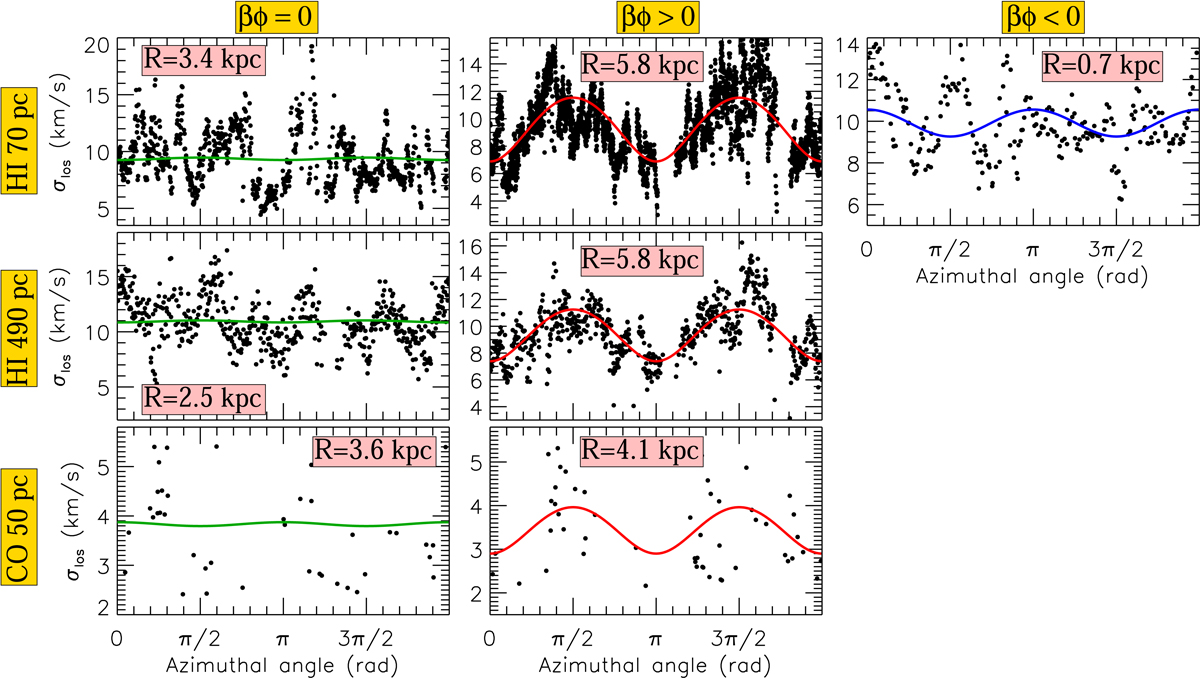
Same as Fig. 2, but using HI data from VLA (70 pc resolution), DRAO (490 pc resolution), and CO data from IRAM 30 m antenna (50 pc resolution) to show results of the anisotropic velocity dispersion model (Sect. 4). The columns illustrate various cases of velocity anisotropy parameter found by the best-fit model: βϕ ∼ 0 (for isotropy, left ), 0 < βϕ (for radial bias, middle), βϕ < 0 (for supposedly tangential bias, right). For each resolution, the selected radii are among the best positions illustrating each case of anisotropy parameter, following Fig. 6. Solid lines represent the best-fit dispersion model at the considered radii, assuming σz = ⟨σlos⟩ϕ.
Current usage metrics show cumulative count of Article Views (full-text article views including HTML views, PDF and ePub downloads, according to the available data) and Abstracts Views on Vision4Press platform.
Data correspond to usage on the plateform after 2015. The current usage metrics is available 48-96 hours after online publication and is updated daily on week days.
Initial download of the metrics may take a while.