Fig. 6.
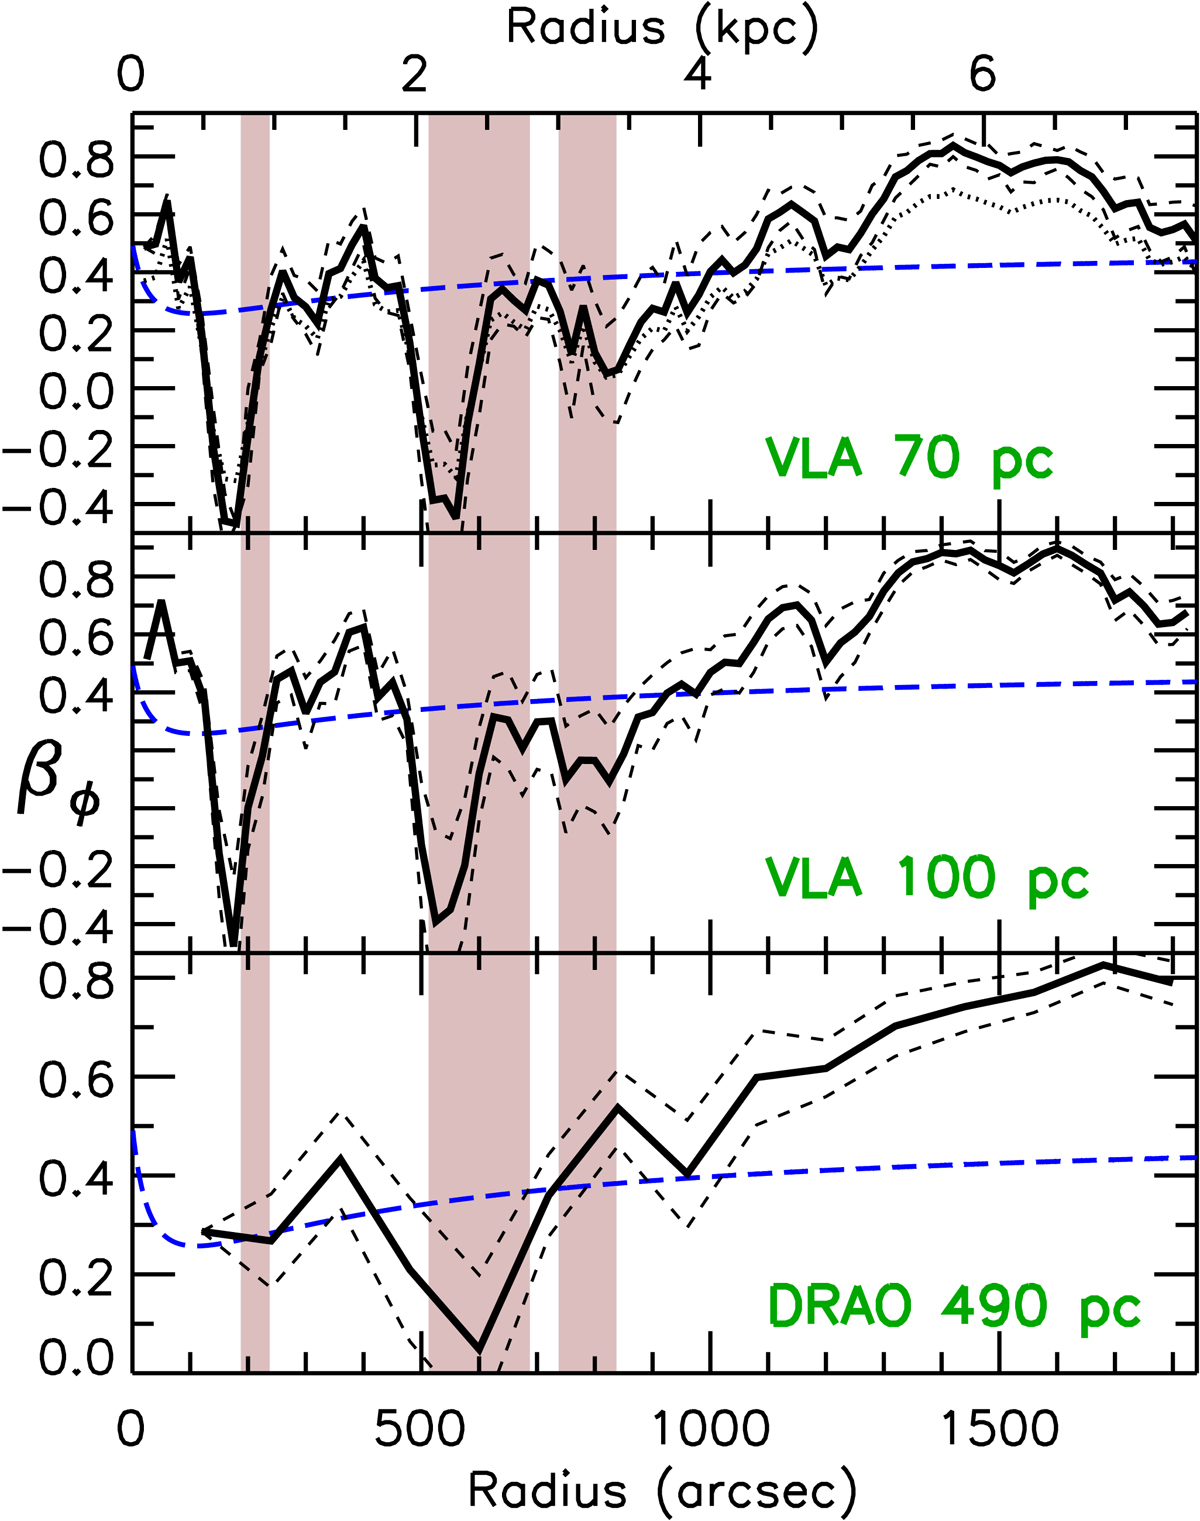
Profiles of azimuthal velocity anisotropy βϕ of the atomic gas in M 33 at different angular resolutions. Solid lines show the anisotropy profiles obtained assuming σz = ⟨σlos⟩ϕ and a null thermal component. Short-dashed lines show the ±1 rms errors; a dotted line is an illustration of result choosing another vertical dispersion, σz = 4 km s−1 (70 pc resolution only); and a blue long-dashed line is the velocity anisotropy profile expected from the epicycle theory (Sect. 5). Shaded areas are as in Fig. 4.
Current usage metrics show cumulative count of Article Views (full-text article views including HTML views, PDF and ePub downloads, according to the available data) and Abstracts Views on Vision4Press platform.
Data correspond to usage on the plateform after 2015. The current usage metrics is available 48-96 hours after online publication and is updated daily on week days.
Initial download of the metrics may take a while.