Fig. 3.
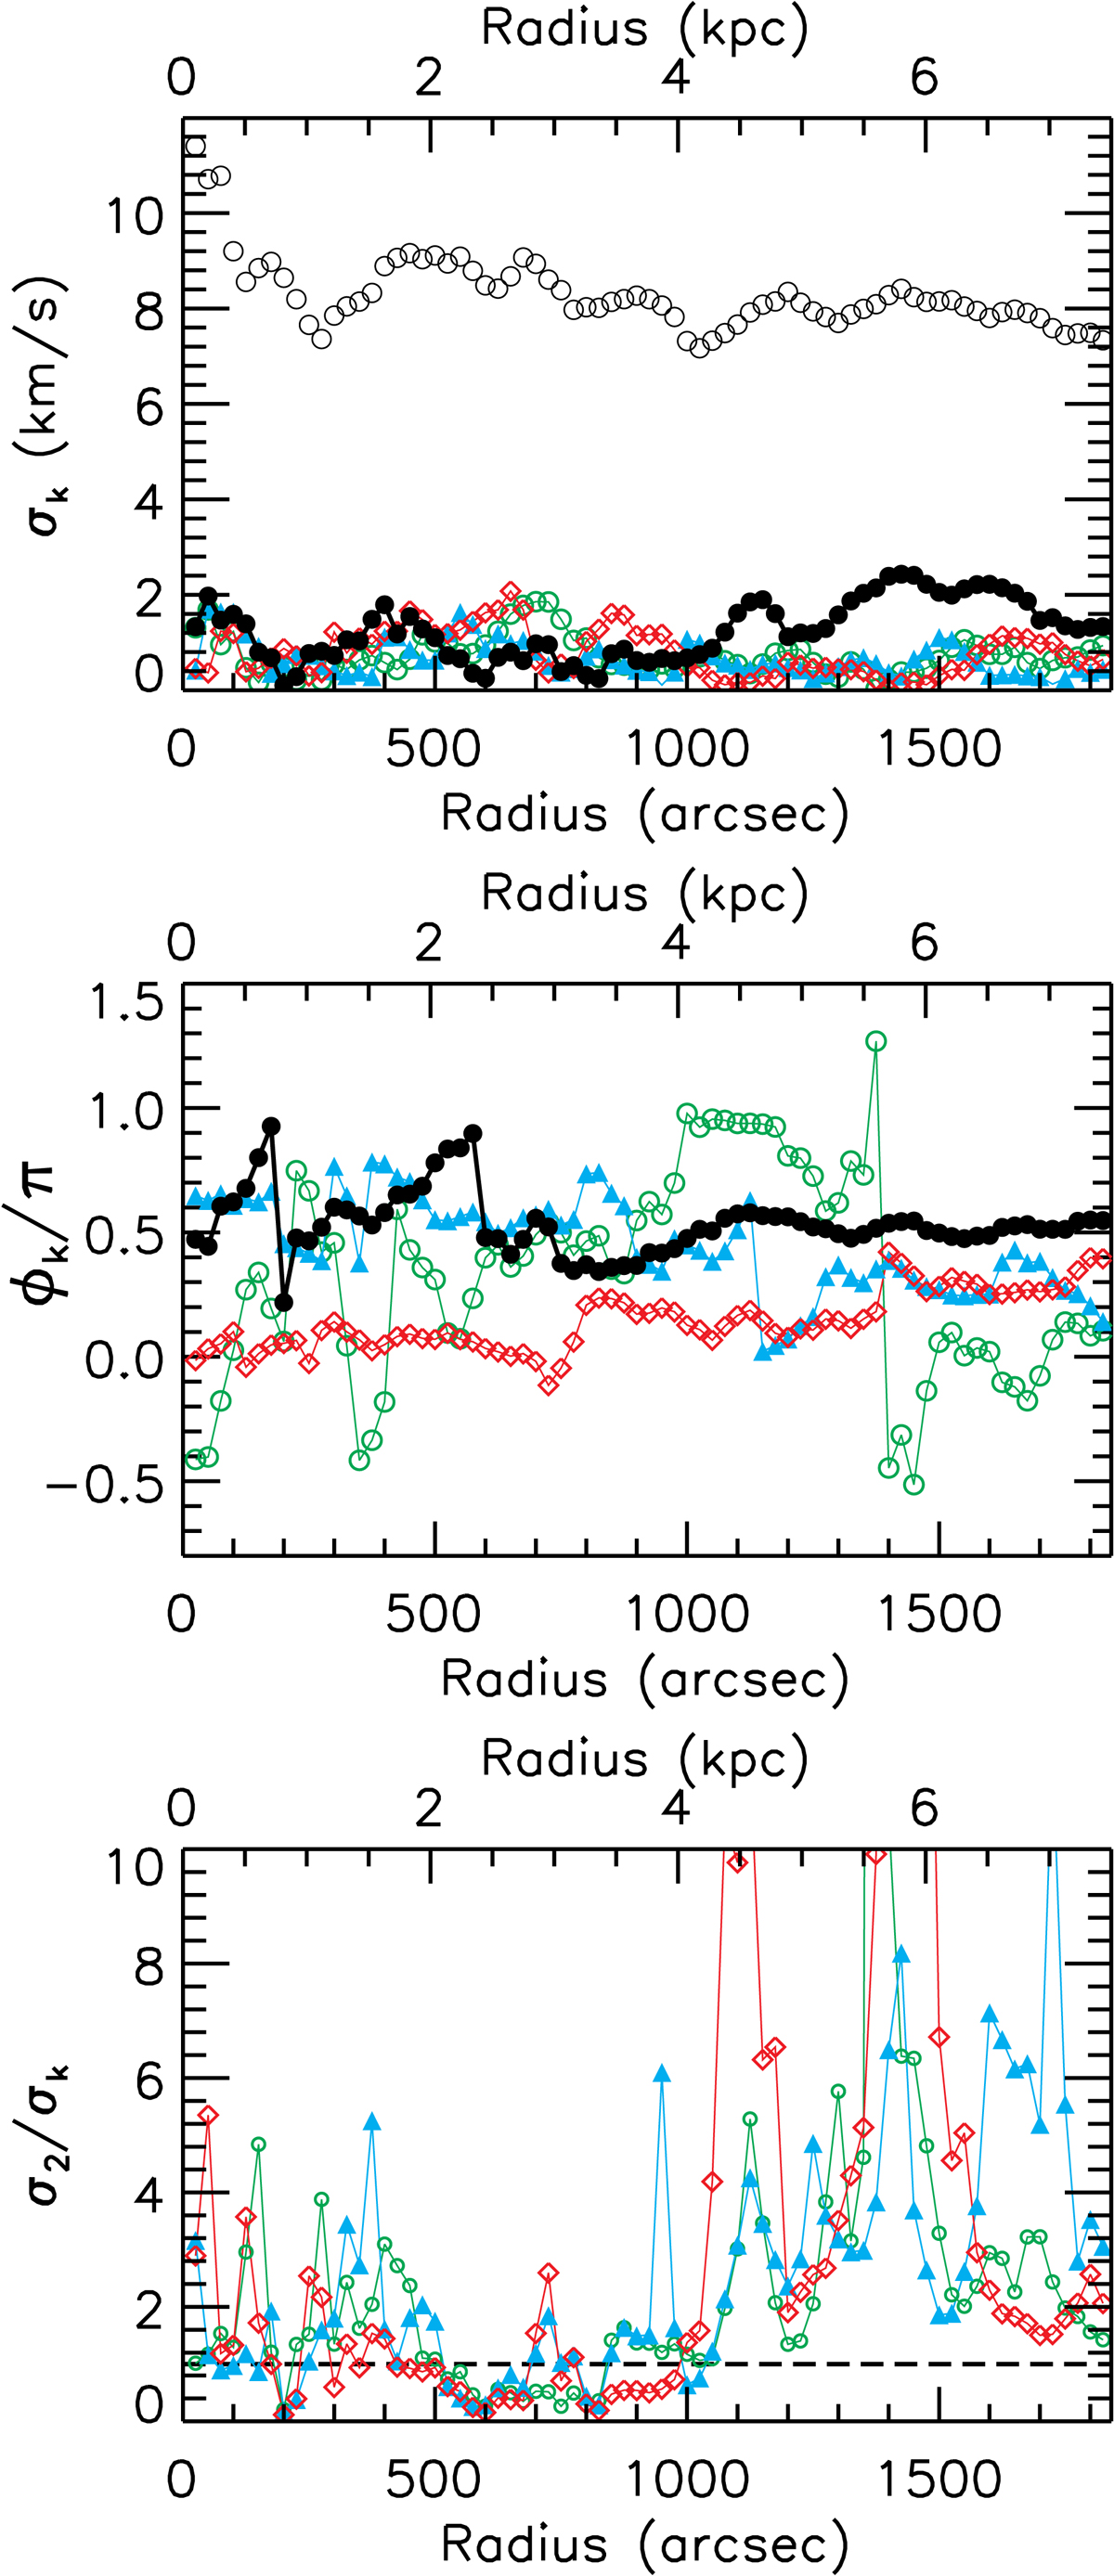
Results of the discrete FFT of the HI velocity dispersion map of M 33 (100 pc resolution, in the CNM case). The amplitudes (upper panel) and phases (middle panel) of the Fourier modes are shown as black open circles (k = 0), green open circles (k = 1), filled circles (k = 2), blue upward filled triangles (k = 3), and red open diamonds (k = 4). The reference ϕ = 0 is chosen along the semi-major axis of the NE approaching half of M 33. Bottom panel: σ2/σk, using the same colors and symbols as above for the k = 1, 3, 4 modes. The range of ratios is chosen up to 10 for clarity, but the total range is 78 for σ2/σ1 and σ2/σ4, and 12 for σ2/σ3.
Current usage metrics show cumulative count of Article Views (full-text article views including HTML views, PDF and ePub downloads, according to the available data) and Abstracts Views on Vision4Press platform.
Data correspond to usage on the plateform after 2015. The current usage metrics is available 48-96 hours after online publication and is updated daily on week days.
Initial download of the metrics may take a while.