Fig. 2.
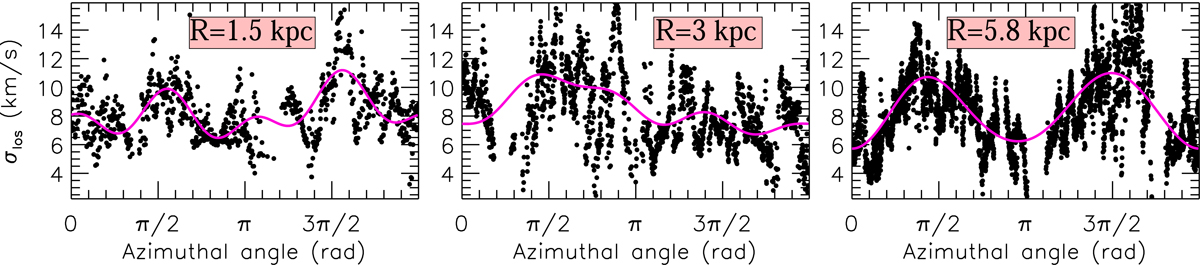
Azimuth-velocity dispersion diagrams of atomic gas at selected radii in M 33. Each point corresponds to an individual measurement, i.e., the dispersion of each pixel within the map. Solid lines represent the results of a Fourier Transform model of the HI dispersion map (Sect. 3, assuming a cold neutral medium case). The dispersions are from the VLA 100 pc resolution data.
Current usage metrics show cumulative count of Article Views (full-text article views including HTML views, PDF and ePub downloads, according to the available data) and Abstracts Views on Vision4Press platform.
Data correspond to usage on the plateform after 2015. The current usage metrics is available 48-96 hours after online publication and is updated daily on week days.
Initial download of the metrics may take a while.