Fig. 1.
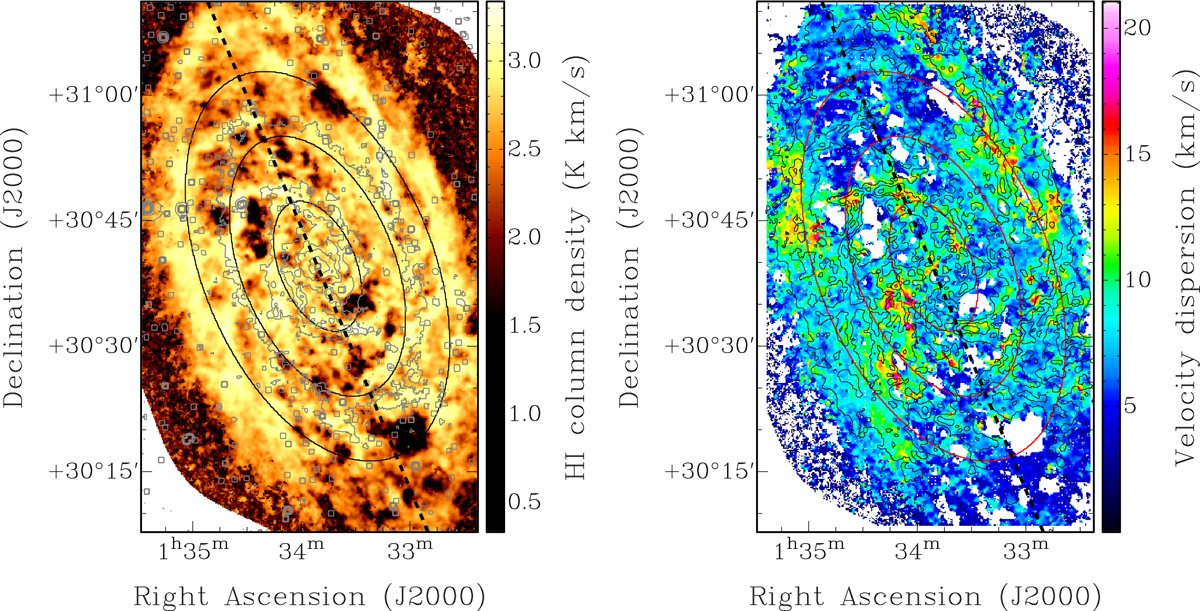
Observational data of Messier 33. Left panel: HI column density map (VLA, 100 pc resolution, logarithmic stretch) with Spitzer/IRAC 3.6 μm stellar distribution overlaid (gray contours, showing the 0.1, 0.3, 0.5, 0.7, 0.9, 1.4, and 2.5 MJy sr−1 levels). Right panel: observed HI velocity dispersion (VLA, 100 pc resolution, not corrected for the instrumental dispersion), with HI column densities contours (1, 2, 3 × 1021 cm−2). The dashed line represents the location of the major axis of the inner unwarped disk, with position angle of 22.5°. Concentric ellipses show the projected locations of R = 2, 4, 6 kpc.
Current usage metrics show cumulative count of Article Views (full-text article views including HTML views, PDF and ePub downloads, according to the available data) and Abstracts Views on Vision4Press platform.
Data correspond to usage on the plateform after 2015. The current usage metrics is available 48-96 hours after online publication and is updated daily on week days.
Initial download of the metrics may take a while.